Prometheus
- 28 Apr 2025
- 2 Minutes to read
- Print
- DarkLight
- PDF
Prometheus
- Updated on 28 Apr 2025
- 2 Minutes to read
- Print
- DarkLight
- PDF
Article summary
Did you find this summary helpful?
Thank you for your feedback!
Prometheus Integration Guide
Prometheus is an open-source monitoring system with a dimensional data model, flexible query language, efficient time series database and modern alerting approach. Integrate AlertOps’ alert management platform with Prometheus to receive and respond to critical alerts through email, SMS, push notification, and phone alerts. AlertOps ensures that alerts received from Prometheus always reach the correct, available team member by utilizing escalation policies and on-call schedules.
AlertOps Configuration
- From the main menu, click on Integrations and then select Inbound Integrations from the sub menu.
- Select API tab
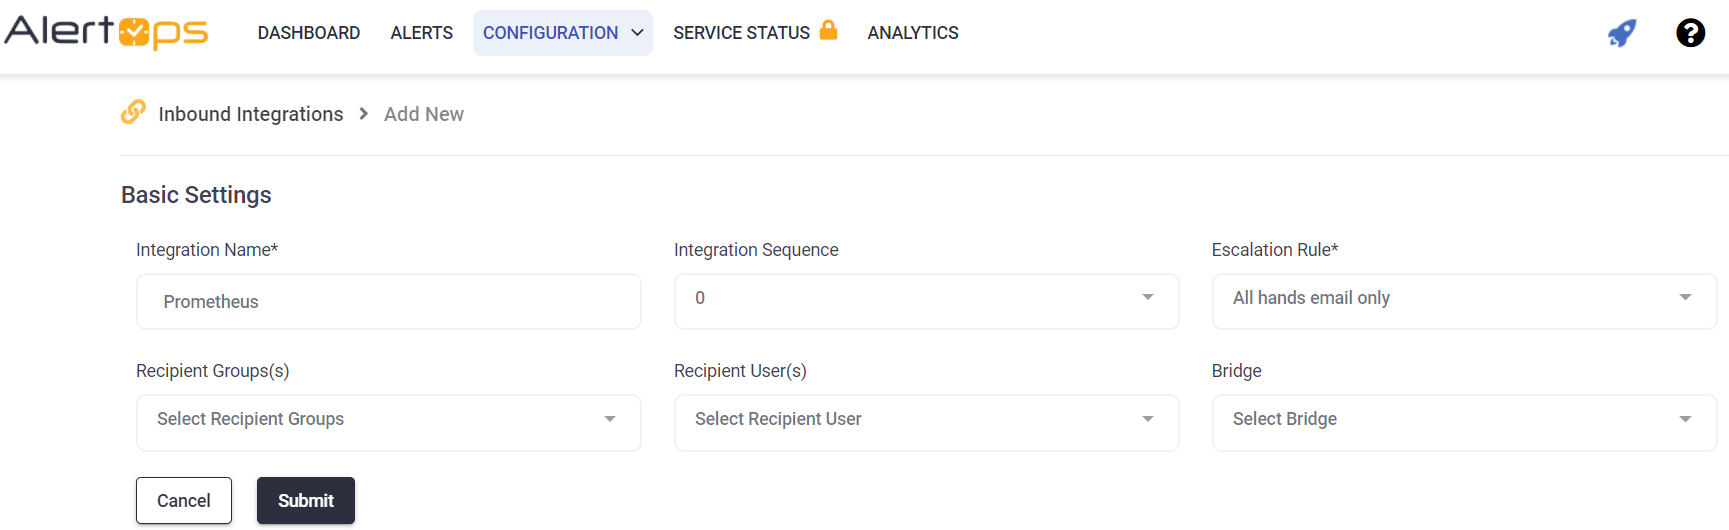
- Select the 'ADD API INTEGRATION' button, you should now be on the API Integration Detail page. Select Prometheus from the pre-built Integration Templates.
- Enter a name for the integration.
- Select an escalation rule to determine the integration's escalation policy.
- Enter the names of recipient group(s) and recipient user(s).
- Click 'SAVE.' Then, click 'COPY URL' to copy the URL endpoint to be used in the Prometheus configuration.
Prometheus Configuration
Step 1: Install Prometheus Alertmanager. The Alertmanager will handle routing alerts from Prometheus. Click here to view documentation.
Step 2: Create and configure an Alertmanager configuration file (default configuration file is labeled alertmanager.yml and located in the same directory as the Alertmanager program file. You can view an image below or find an example file on Github. Click here to view documentation.
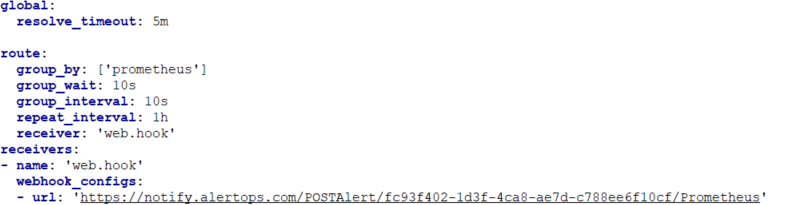
Step 3: Create a receiver for a webhook to post to AlertOps within your Alertmanager configuration file as shown above. Provide a name for your receiver. In addition, paste the Integration URL you copied from AlertOps in the url field, that you see, in the format below:
receivers:
- name: Receiver_Name
webhook_configs:
- url: 'Integration_URL'
Step 4: You can configure the default route within your Alertmanager configuration file to send to a single AlertOps endpoint as follows:
route:
- group_by: [cluster]
receiver: Receiver_Name
OR
You can configure custom routes to send alerts to different receivers (AlertOps Integrations) using various match conditions as follows. The example below depicts routing to the receiver when the severity is critical:
route:
- match:
severity: 'critical'
receiver: Receiver_Name
View an example configuration that routes alerts to two different Integrations within AlertOps based on if an alert is critical or non-critical:
route:
group_by: [cluster]
receiver: Default_Receiver_Name
group_interval: 1m
routes:
- match:
severity: 'critical'
receiver: Critical_Receiver_Name
receivers:
- name: Default_Receiver_Name
webhook_configs:
- url: 'Integration1_URL'
- name: Critical_Receiver_Name
webhook_configs:
- url: 'Integration2_URL'
Step 5: Restart the AlertManager to load your new configuration. Now you can setup targets or jobs to monitor to test your integration.
Alert Triggering Information
AlertOps will automatically create an incident when a new alert is received from Prometheus with an IncidentStatus status of “firing.”
If an alert with status “firing” matches an existing Open Alert, AlertOps will recognize the new alert as a duplicate and ignore the alert. The alert will be recorded in the Inbound Messages table as “Mapped Appended.”
AlertOps will automatically close the same incident when an alert with an IncidentStatus status “resolved” is received.
Testing and Troubleshooting
Click here to read about Web API Testing and Troubleshooting.
Was this article helpful?