Power Admin(PA) Server Monitor
- 12 May 2023
- 3 Minutes to read
- Print
- DarkLight
- PDF
Power Admin(PA) Server Monitor
- Updated on 12 May 2023
- 3 Minutes to read
- Print
- DarkLight
- PDF
Article summary
Did you find this summary helpful?
Thank you for your feedback!
AlertOps and PA Server Monitor
AlertOps’ alert management system can be integrated with PA Server Monitor to receive and respond to all (predefined status mappings) alerts through email, SMS, push notification or phone alerts. AlertOps would ensure that the alert/job status would reach the appropriate team by using proper workflows, escalation policies and schedules. Based on your ruleset, incidents can be automatically opened and closed, depending on what kind of alert PA Server Monitor reports.
The above scenario and scope for integration is due to the fact that AlertOps has a very flexible and simple API/Webhook configuration feature that can be leveraged with PA Server Monitor's alert and action capabilities.
AlertOps - Inbound Integration
We can define rulesets in AlertOps so that PA Server Monitor can send out alerts to the AlertOps platform. AlertOps would ensure based on these notifications received, that it would always reach out and assign to the correct person/team by utilizing its escalation policies, schedules, and workflow features.
AlertOps provides Inbound Integrations to integrate with numerous monitoring, chat and ITSM tools. You can configure an inbound integration for PA Server Monitor.
At a high level this is how the flow looks like, you define an API integration in the AlertOps platform by defining settings like Integration Name, Escalation rules, recipient users/groups. Once an integration is defined, a unique API URL is generated. This acts as webhook or the gateway through which notifications from PA Server Monitor reach AlertOps and thus an incident/alert is created correspondingly. The API can be defined with various settings like URL mappings, filters, escalations etc. as required. PA Server Monitor has to be configured with a HTTP URL Action and that has to be added to a monitor.

Configure Inbound Integration in AlertOps
- Navigate to Configuration àIntegrations àAdd API Integration à API Integration Detail page.
- Select PA Server Monitor (else select Custom)
- Once you selected the integration, you can then specify basic settings like the integration name, escalation policy, names of the recipients/groups for which the alerts must be assigned to.
- Once you click save, the API Integration will be created, and you will be given a unique URL which acts as the access point and needs to be configured at the source (in this case PA Server Monitor), to send alerts. You can find the integration you just created, and you can give advanced settings and define various configurations for the alerts to be received and processed. For example, you can define when to open and close alerts based on the payload obtained from the API call, filters etc.
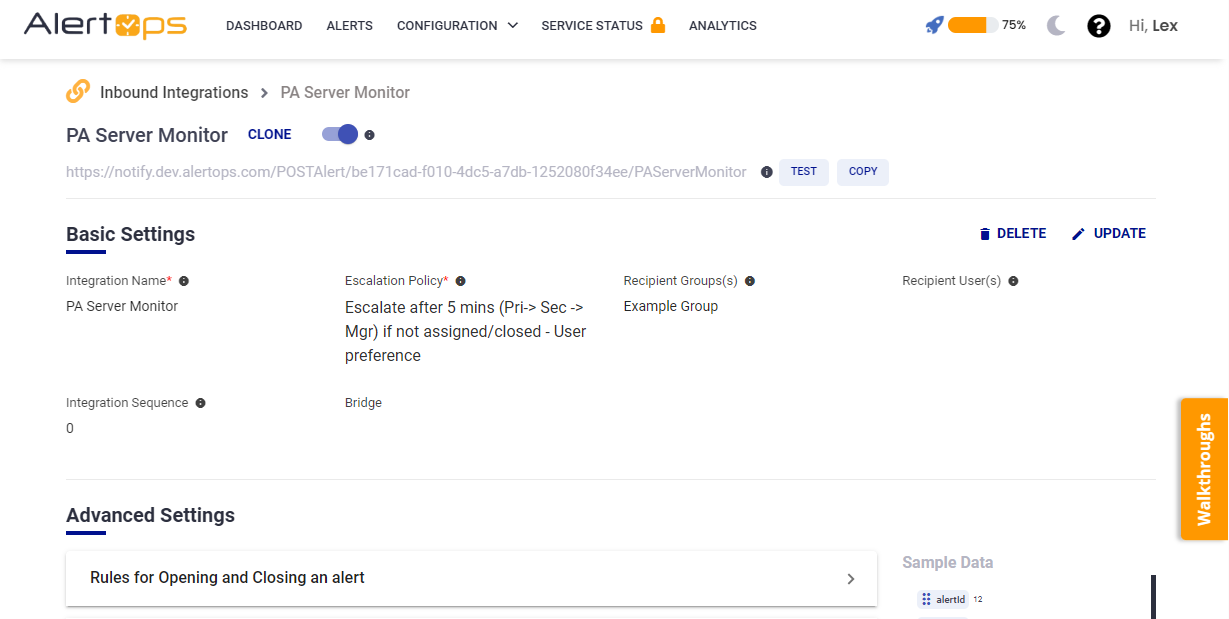
- Make a note of the API URL, which will be used in PA Server Monitor, so it calls a HTTP POST request to this URL with the body in JSON format containing the alert specific information. AlertOps automatically creates an alert when the status variable (StatusText) contains 'Alert/Error'. The incident will also be closed automatically when the status 'OK' is received from PA Server Monitor
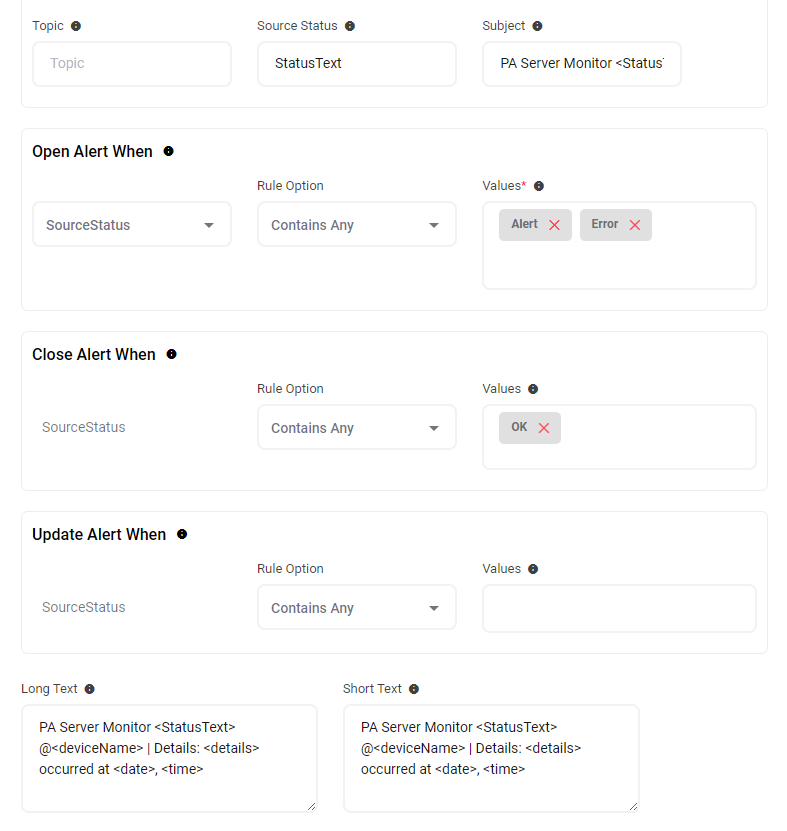
- You can similarly define Rules for Opening and Closing Alerts as you want in Advanced settings, owing to the flexibility provided by AlertOps’ OpenAPI/Plug-and-Play integrations. You can provide other filters and match with regex expressions as well. You can also test the generated URL with the sample data provided.
Configure Integration in PA Server Monitor
- In your PA Server Monitor Application Console, in the left navigation pane, select 'All Actions'

- Right Click 'Call URL Action' and click on 'Add Action'
- Give a 'Description'; under 'URL to call', paste the AlertOps Inbound Integration API URL. 'Pass Parameters' as 'Custom POST'
- Content-Type Header value will be 'application/json'
- Under Parameters to pass, paste the following,
{
 "alertId": "$AlertID$",
 "Status": "$Status$",
 "StatusText": "$StatusText$",
 "details": "$Details$",
 "deviceName": "$DeviceName$",
 "deviceIP": "$DeviceIP$",
 "deviceID": "$DeviceID$",
 "group": "$Group$",
 "machineIP": "$MachineIP$",
 "machineID": "$MachineID$",
 "monitortitle": "$MonitorTitle$",
 "monitorMessage":"$MonitorMsg$",
 "monitorType": "$MonitorType$",
 "satelliteName": "$Satellite_Name$",
 "date": "$Date$",
 "time": "$Time$",
 "uId": "$UniqueID$"
}
6. You can test the action to see if the action test alert went through to AlertOps. The test should succeed. Click OK.

7. After creating the Action, make sure the monitor(s) under Servers/Devices, has the AlertOps Action under the Monitor's Action settings for both 'Error Actions' and 'Resolved Actions'

Thats it! You have configured a HTTP Action and attached it to a monitor. Any alert will be sent to AlertOps for incident management.
Message logs, alert specific information can be viewed in the “Inbound Log” section in AlertOps Dashboard. Alerts can be viewed in the ‘Alerts’ tab as well.
Alert Triggering Information
AlertOps will automatically create an incident when a new alert is received from PA Server Monitor when the StatusText contains "Alert/Error".
If an alert with status "Alert/Error" matches an existing Open Alert, AlertOps will recognize the new alert as a duplicate and ignore the alert.
The alert will be recorded in the Inbound Messages table as “Mapped Appended.”
AlertOps will automatically close the same incident when an alert with StatusText contains "OK".
References
Was this article helpful?