- 06 May 2024
- 24 Minutes to read
- Print
- DarkLight
- PDF
NetCrunch
- Updated on 06 May 2024
- 24 Minutes to read
- Print
- DarkLight
- PDF
NetCrunch Integration Guide
NetCrunch is a comprehensive network monitoring tool, it can monitor your entire network out of the box and can also be easily extended with scripts and custom agents using REST API. Integrate AlertOps’ alert management platform with NetCrunch to receive and respond to critical alerts through email, SMS, push notification, and phone alerts. AlertOps ensures that alerts received from NetCrunch always reach the correct, available team member by utilizing escalation policies and on-call schedules.
AlertOps Configuration
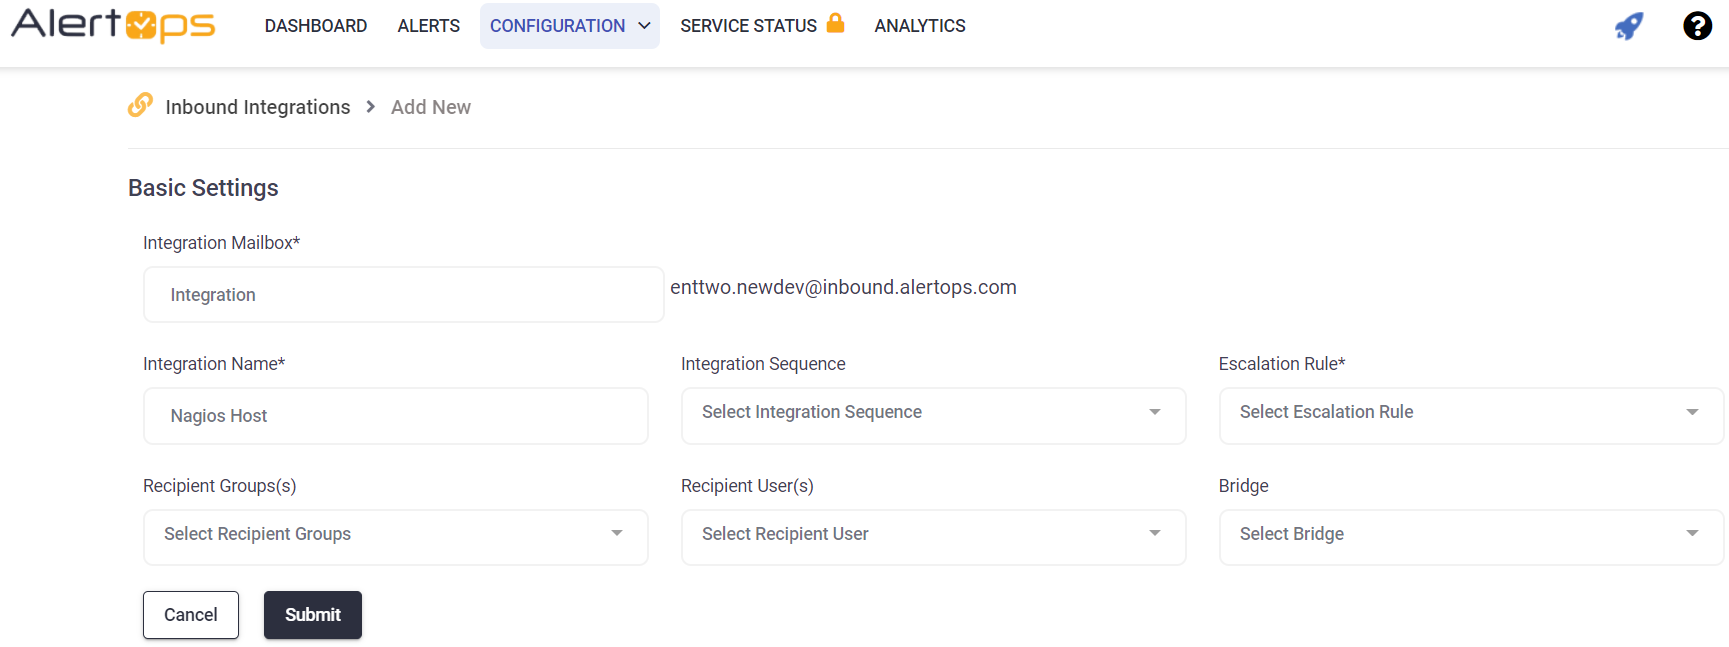
- From the main menu, click on Integrations and then select Inbound Integrations from the sub menu.
- Select API tab
- Select the 'ADD API INTEGRATION' button, you should now be on the API Integration Detail page.
- Select NetCrunch from the pre-built Integration Templates.
- Enter a name for the integration. Select an escalation rule to determine the integration's escalation policy.
- Enter the names of recipient group(s) and recipient user(s).
- Click 'SAVE.' Then, click 'COPY URL' to copy the URL endpoint to be used in the NetCrunch configuration.
NetCrunch Configuration
Step 1: Enable NetCrunch to post alerts to AlertOps Please Click here to learn how to configure AlertOps in NetCrunch.
Alert Triggering Information
AlertOps will automatically create an incident when a new alert is received from NetCrunch with an IncidentStatus status of “Opened”.
If an alert with status “Opened” matches an existing Open Alert, AlertOps will recognize the new alert as a duplicate and ignore the alert. The alert will be recorded in the Inbound Messages table as “Mapped Appended.”
AlertOps will automatically close the same incident when an alert with an IncidentStatus status “Closed” is received.
Testing and Troubleshooting
Click here to read about Web API Testing and Troubleshooting.
New Relic
New Relic Integration Guide
New Relic is an all-in-one web application performance tool that measures efficiency and offers real-user monitoring for the entire IT infrastructure. Integrate AlertOps’ alert management platform with New Relic to receive and respond to critical alerts through email, SMS, push notification, and phone alerts. AlertOps ensures that alerts received from New Relic always reach the correct, available team member by utilizing escalation policies and on-call schedules.
AlertOps Configuration
- From the main menu, click on Integrations and then select Inbound Integrations from the sub menu.
- Select API tab
- Select the 'ADD API INTEGRATION' button, you should now be on the API Integration Detail page.
- Select NewRelic from the pre-built Integration Templates.
- Enter a name for the integration. Select an escalation rule to determine the integration's escalation policy.
- Enter the names of recipient group(s) and recipient user(s).
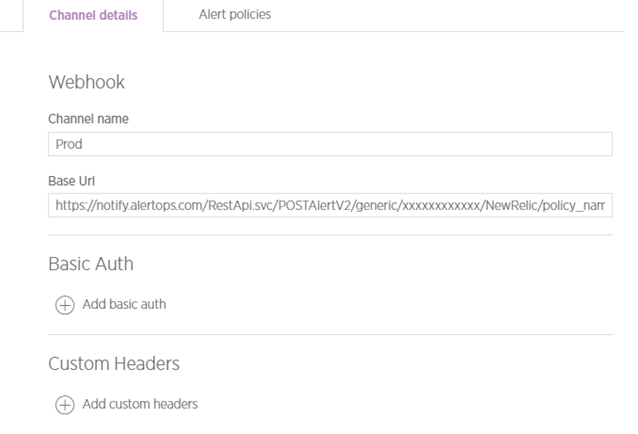
- Click 'SAVE.' Then, click 'COPY URL' to copy the URL endpoint to be used in the New Relic configuration.

New Relic Configuration
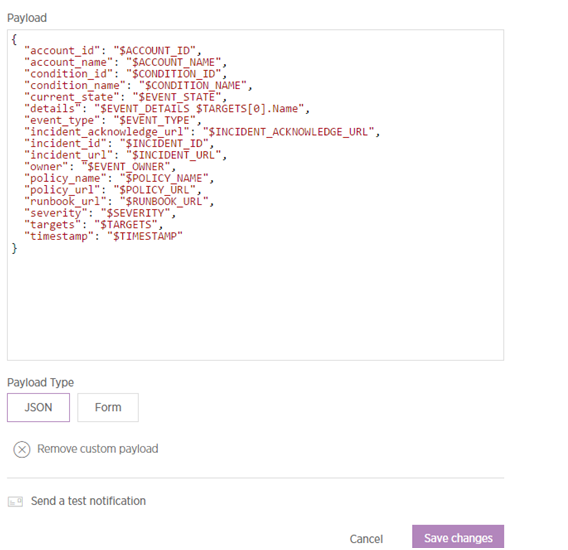
Step 1: Create a webhook in New Relic.
Alert Triggering Information
AlertOps will automatically create an incident when a new alert is received from New Relic with an IncidentStatus status of “open.”
If an alert with status “open” matches an existing Open Alert, AlertOps will recognize the new alert as a duplicate and ignore the alert. The alert will be recorded in the Inbound Messages table as “Mapped Appended.”
AlertOps will automatically close the same incident when an alert with an IncidentStatus status “closed” is received.
Testing and Troubleshooting
Click here to read about Web API Testing and Troubleshooting.
New Relic Legacy
New Relic Legacy Integration Guide
New Relic Legacy is an all-in-one web application performance tool that measures efficiency and offers real-user monitoring for the entire IT infrastructure. Integrate AlertOps’ alert management platform with New Relic Legacy to receive and respond to critical alerts through email, SMS, push notification, and phone alerts. AlertOps ensures that alerts received from New Relic Legacy always reach the correct, available team member by utilizing escalation policies and on-call schedules.
AlertOps Configuration
- From the main menu, click on Integrations and then select Inbound Integrations from the sub menu.
- Select API tab
- Select the 'ADD API INTEGRATION' button, you should now be on the API Integration Detail page.
- Select NewRelicLegacy from the pre-built Integration Templates.
- Enter a name for the integration. Select an escalation rule to determine the integration's escalation policy.
- Enter the names of recipient group(s) and recipient user(s).
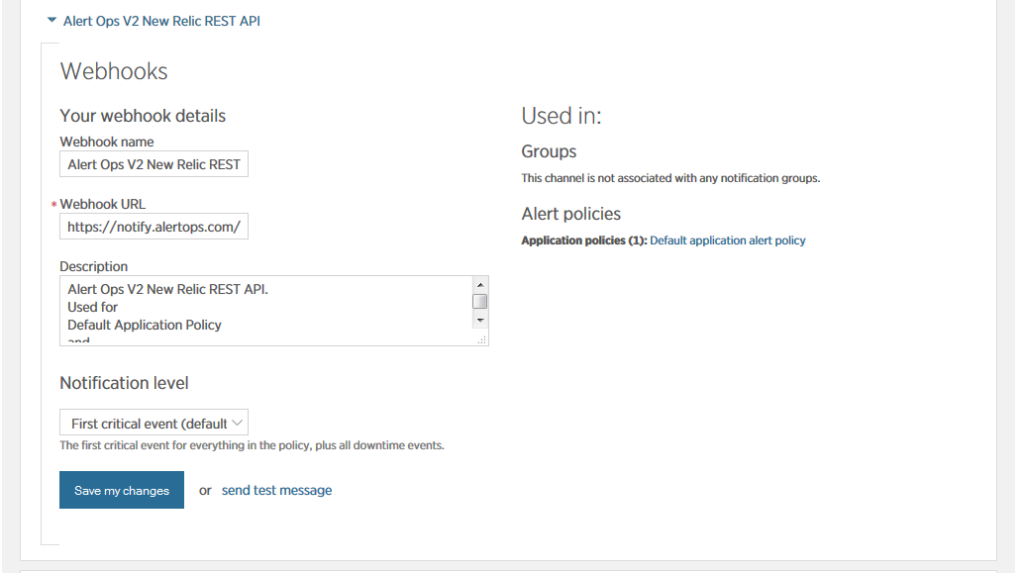
- Click 'SAVE.' Then, click 'COPY URL' to copy the URL endpoint to be used in the New Relic Legacy configuration.

New Relic Legacy Configuration
Step 1: Create a webhook in New Relic Legacy.
Alert Triggering Information
AlertOps will automatically create an incident when a new alert is received from New Relic Legacy with an IncidentStatus status of “alert opened.”
If an alert with status “alert opened” matches an existing Open Alert, AlertOps will recognize the new alert as a duplicate and ignore the alert. The alert will be recorded in the Inbound Messages table as “Mapped Appended.”
AlertOps will automatically close the same incident when an alert with an IncidentStatus status “alert ended” is received.
Testing and Troubleshooting
Click here to read about Web API Testing and Troubleshooting.
Nodeping
NodePing Integration Guide
NodePing monitors servers and websites such as: HTTP(S), SMTP, DNS, PING, and many more. Integrate AlertOps’ alert management platform with NodePing to receive and respond to critical alerts through email, SMS, push notification, and phone alerts. AlertOps ensures that alerts received from NodePing always reach the correct, available team member by utilizing escalation policies and on-call schedules.
AlertOps Configuration
- From the main menu, click on Integrations and then select Inbound Integrations from the sub menu.
- Select API tab
- Select the 'ADD API INTEGRATION' button, you should now be on the API Integration Detail page. Select NodePing from the pre-built Integration Templates.
- Enter a name for the integration. Select an escalation rule to determine the integration's escalation policy.
- Enter the names of recipient group(s) and recipient user(s).
- Click 'SAVE.' Then, click 'COPY URL' to copy the URL endpoint to be used in the NodePing configuration.

NodePing Configuration
Step 1: Create a webhook in NodePing. Click here to view NodePing Webhook Notifications Documentation.
Step 2: Expand toggle to view Data Sample - Status: DOWN
/RESTAPI.svc/SubmitAlertGet/genericget/12ae8a55-22ee-4761-ac59-d8e6d182ef78/label/tg/uuid/event/none/none _id=201412311550XE2PK-A419EGX5-1420046697376&ci=201412311550XE2PK&t=HTTP&tg=https%3A%2F%2Fcyberkorp.test.gocybertalk.com%3A30443%2Fclientservice.sv&th=5&i=1&ra=1420046690652&q=nvvzQwyvue&s=1420046697376&sc=404&su=false&rt=656&rhp=rh8&m=HTTP%20status%20returned%3A%20404&e=1420046698032&l=ny%2Cnj%2Cnv&event=down&label=Node%20Ping&uuid=9pieggn2-jxzd-4arx-a3wt-wp71ls0rvmbh
Status UP
/RESTAPI.svc/SubmitAlertGet/genericget/12ae8a55-22ee-4761-ac59-d8e6d182ef78/label/label/uuid/event/none/none _id=201412311550XE2PK-A419EGX5-1420047147464&ci=201412311550XE2PK&t=HTTP&tg=https%3A%2F%2Fcyberkorp.test.gocybertalk.com%3A30443%2Fclientservice.svc&th=5&i=1&ra=1420047145118&q=azCaQAjLAx&s=1420047147464&sc=200&su=true&rt=956&rhp=rh8&m=Success&e=1420047148420&l=co%2Cny%2Caz&event=up&label=Node%20Ping&uuid=9pieggn2-jxzd-4arx-a3wt-wp71ls0rvmbh
Alert Triggering Information
AlertOps will automatically create an incident when a new alert is received from NodePing with an IncidentStatus status of “down.”
If an alert with status “down” matches an existing Open Alert, AlertOps will recognize the new alert as a duplicate and ignore the alert. The alert will be recorded in the Inbound Messages table as “Mapped Appended.”
AlertOps will automatically close the same incident when an alert with an IncidentStatus status “up” is received.
Testing and Troubleshooting
Click here to read about Web API Testing and Troubleshooting.
Observium
Observium Integration Guide
Observium is a low-maintenance auto-discovering network monitoring platform supporting a wide range of device types, platforms and operating systems including Cisco, Windows, Linux, HP, Juniper, Dell, FreeBSD, Brocade, Netscaler, NetApp and many more. Observium focuses on providing a beautiful and powerful yet simple and intuitive interface to the health and status of your network.Integrate AlertOps’ alert management platform with Observium to receive and respond to critical alerts through email, SMS, push notification, and phone alerts. AlertOps ensures that alerts received from Observium always reach the correct, available team member by utilizing escalation policies and on-call schedules.
Configuration
- From the main menu, click on Integrations and then select Inbound Integrations from the sub menu.
- Select API tab
- Select the 'ADD API INTEGRATION' button, the API Integration Detail page opens
- Select Observium from the pre-built Integration Templates.
- Enter a name for the integration.
- Select an escalation rule to determine the integration's escalation policy.
- Enter the names of recipient group(s) and recipient user(s).
- Click 'SAVE.'
- Click 'COPY URL' to copy the URL endpoint to be used in the Observium configuration.

- Click here to Refer Observium Webhook documentation.
Alert Triggering Information
AlertOps will automatically create an incident when a new alert is received from Observium with an IncidentStatus status of “ALERT.”
If an alert with status “ALERT” matches an existing Open Alert, AlertOps will recognize the new alert as a duplicate and ignore the alert. The alert will be recorded in the Inbound Messages table as “Mapped Appended.”
AlertOps will automatically close the same incident when an alert with an IncidentStatus status “RECOVER” is received.
Testing and Troubleshooting
Click here to read about Web API Testing and Troubleshooting.
Panopta
Panopta Integration Guide
Panopta provides infrastructure monitoring and incident management services to enterprises and SMEs, with the ability to provide comprehensive visibility to on-premise, cloud, and hybrid environments. Integrate AlertOps’ alert management platform with Panopta to receive and respond to critical alerts through email, SMS, push notification, and phone alerts. AlertOps ensures that alerts received from Panopta always reach the correct, available team member by utilizing escalation policies and on-call schedules.
AlertOps Configuration
- From the main menu, click on Integrations and then select Inbound Integrations from the sub menu.
- Select API tab
- Select the 'ADD API INTEGRATION' button.
- You should now be on the API Integration Detail page. Select Panopta from the pre-built Integration Templates.
- Enter a name for the integration.
- Select an escalation rule to determine the integration's escalation policy.
- Enter the names of recipient group(s) and recipient user(s). Click 'SAVE.' Then, click 'COPY URL' to copy the URL endpoint to be used in the Panopta configuration.

Panopta Configuration
Step 1: Create a webhook in Panopta and add the AlertOps webhook notification to a Notification Schedule.

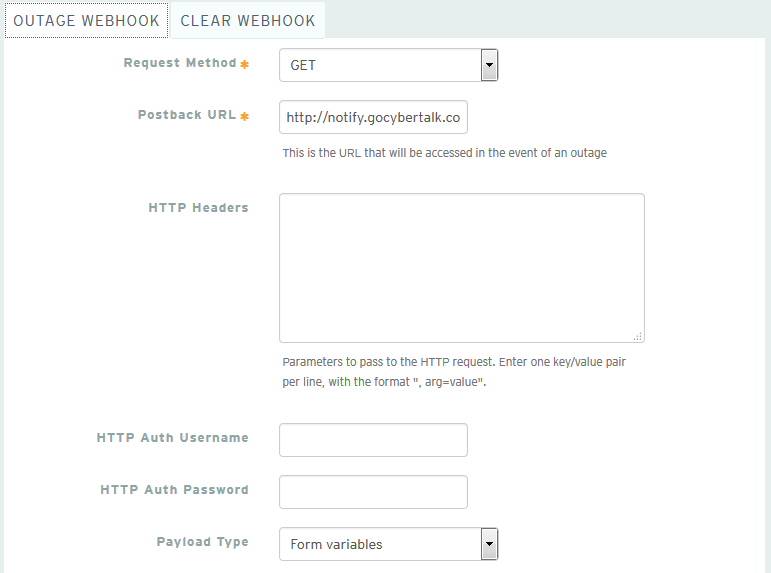
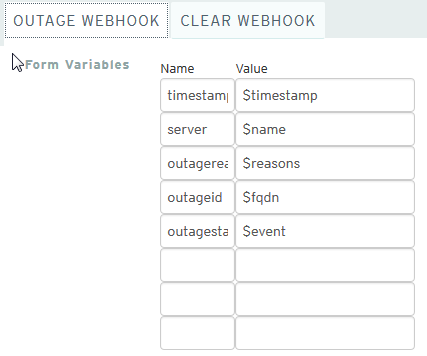

Alert Triggering Information
AlertOps will automatically create an incident when a new alert is received from Panopta with an IncidentStatus status of “outage event.”
If an alert with status “outage event” matches an existing Open Alert, AlertOps will recognize the new alert as a duplicate and ignore the alert. The alert will be recorded in the Inbound Messages table as “Mapped Appended.”
AlertOps will automatically close the same incident when an alert with an IncidentStatus status “clear event” is received.
Testing and Troubleshooting
Click here to read about Web API Testing and Troubleshooting.
Pingdom
Pingdom Integration Guide
Pingdom is a simple and convenient tool to monitor the uptime of your website and other infrastructure. Integrate AlertOps’ alert management platform with Pingdom to receive and respond to critical alerts through email, SMS, push notification, and phone alerts. AlertOps ensures that alerts received from Pingdom always reach the correct, available team member by utilizing escalation policies and on-call schedules.
AlertOps Configuration
- From the main menu, click on Integrations and then select Inbound Integrations from the sub menu.
- Select API tab
- Select the 'ADD API INTEGRATION' button, you should now be on the API Integration Detail page.
- Select Pingdom from the pre-built Integration Templates.
- Enter a name for the integration. Select an escalation rule to determine the integration's escalation policy.
- Enter the names of recipient group(s) and recipient user(s).
- Click 'SAVE.' Then, click 'COPY URL' to copy the URL endpoint to be used in the Pingdom configuration.

Pingdom Configuration
Step 1: Click Integrations in Pingdom and the click Add integration. In the Add Integration Enter a Name and in the URL Paste the AlertOps URL you copied before.

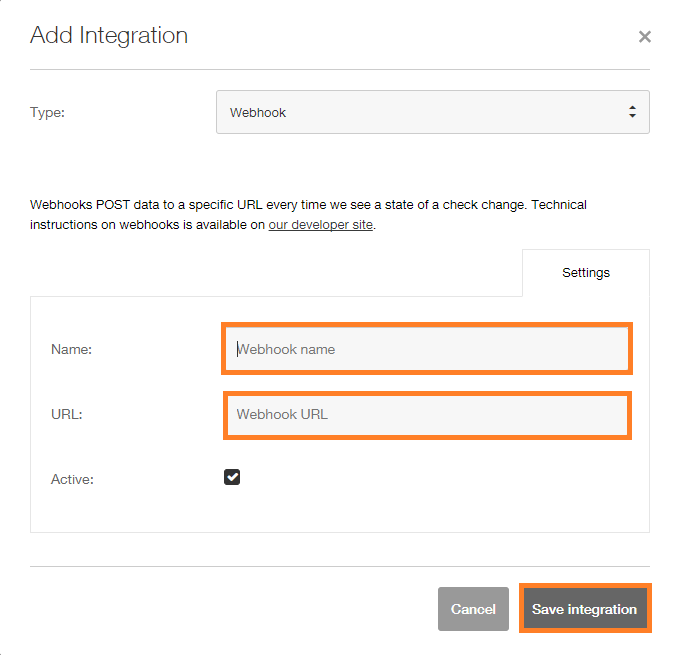
Step 2: Click on Uptime in menu, then on Add New. Type in Name of Check and URL/IP. Fill out rest of form. Then, select the webhook you created in step 1 from the list. Then Click Test or Select Check.
Alert Triggering Information
AlertOps will automatically create an incident when a new alert is received from Pingdom with an IncidentStatus status of “down.”
If an alert with status “down” matches an existing Open Alert, AlertOps will recognize the new alert as a duplicate and ignore the alert. The alert will be recorded in the Inbound Messages table as “Mapped Appended.”
AlertOps will automatically close the same incident when an alert with an IncidentStatus status “up” is received.
Testing and Troubleshooting
Click here to read about Web API Testing and Troubleshooting.
Prometheus
Prometheus Integration Guide
Prometheus is an open-source monitoring system with a dimensional data model, flexible query language, efficient time series database and modern alerting approach. Integrate AlertOps’ alert management platform with Prometheus to receive and respond to critical alerts through email, SMS, push notification, and phone alerts. AlertOps ensures that alerts received from Prometheus always reach the correct, available team member by utilizing escalation policies and on-call schedules.
AlertOps Configuration
- From the main menu, click on Integrations and then select Inbound Integrations from the sub menu.
- Select API tab
- Select the 'ADD API INTEGRATION' button, you should now be on the API Integration Detail page. Select Prometheus from the pre-built Integration Templates.
- Enter a name for the integration.
- Select an escalation rule to determine the integration's escalation policy.
- Enter the names of recipient group(s) and recipient user(s).
- Click 'SAVE.' Then, click 'COPY URL' to copy the URL endpoint to be used in the Prometheus configuration.

Prometheus Configuration
Step 1: Install Prometheus Alertmanager. The Alertmanager will handle routing alerts from Prometheus. Click here to view documentation.
Step 2: Create and configure an Alertmanager configuration file (default configuration file is labeled alertmanager.yml and located in the same directory as the Alertmanager program file. You can view an image below or find an example file on Github. Click here to view documentation.

Step 3: Create a receiver for a webhook to post to AlertOps within your Alertmanager configuration file as shown above. Provide a name for your receiver. In addition, paste the Integration URL you copied from AlertOps in the url field, that you see, in the format below:
receivers:
- name: Receiver_Name
webhook_configs:
- url: 'Integration_URL'
Step 4: You can configure the default route within your Alertmanager configuration file to send to a single AlertOps endpoint as follows:
route:
- group_by: [cluster]
receiver: Receiver_Name
OR
You can configure custom routes to send alerts to different receivers (AlertOps Integrations) using various match conditions as follows. The example below depicts routing to the receiver when the severity is critical:
route:
- match:
severity: 'critical'
receiver: Receiver_Name
View an example configuration that routes alerts to two different Integrations within AlertOps based on if an alert is critical or non-critical:
route:
group_by: [cluster]
receiver: Default_Receiver_Name
group_interval: 1m
routes:
- match:
severity: 'critical'
receiver: Critical_Receiver_Name
receivers:
- name: Default_Receiver_Name
webhook_configs:
- url: 'Integration1_URL'
- name: Critical_Receiver_Name
webhook_configs:
- url: 'Integration2_URL'
Step 5: Restart the AlertManager to load your new configuration. Now you can setup targets or jobs to monitor to test your integration.
Alert Triggering Information
AlertOps will automatically create an incident when a new alert is received from Prometheus with an IncidentStatus status of “firing.”
If an alert with status “firing” matches an existing Open Alert, AlertOps will recognize the new alert as a duplicate and ignore the alert. The alert will be recorded in the Inbound Messages table as “Mapped Appended.”
AlertOps will automatically close the same incident when an alert with an IncidentStatus status “resolved” is received.
Testing and Troubleshooting
Click here to read about Web API Testing and Troubleshooting.
PRTG
PRTG Integration Guide
PRTG Network Monitor is the all-in-one monitoring solution that collects and displays status information from your IT infrastructure. Integrate AlertOps’ alert management platform with PRTG to receive and respond to critical alerts through email, SMS, push notification, and phone alerts. AlertOps ensures that alerts received from PRTG always reach the correct, available team member by utilizing escalation policies and on-call schedules.
AlertOps Configuration
- From the main menu, click on Integrations and then select Inbound Integrations from the sub menu.
- Select API tab
- Select the 'ADD API INTEGRATION' button, you should now be on the API Integration Detail page. Select PRTG from the pre-built Integration Templates.
- Enter a name for the integration.
- Select an escalation rule to determine the integration's escalation policy.
- Enter the names of recipient group(s) and recipient user(s).
- Click 'SAVE.' then, click 'COPY URL' to copy the URL endpoint to be used in the PRTG configuration.

PRTG Network Monitor Configuration
Step 1: In the PRTG Network Monitor menu option Select Setup -> Account Settings -> Notification Templates
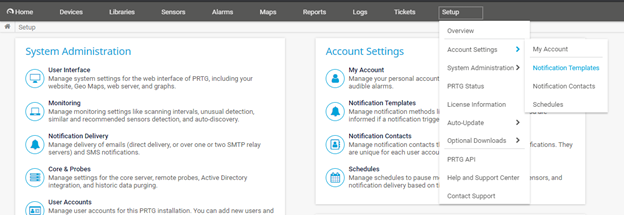
Step 2: Select Add Notification Template

Step 3: Select “Execute HTTP Action”

Step 4: Configure your HTTP Action with your AlertOps Integration Endpoint URL and the HTTP Method as POST. For the Notification Summarization select "Always notify ASAP never summarize"

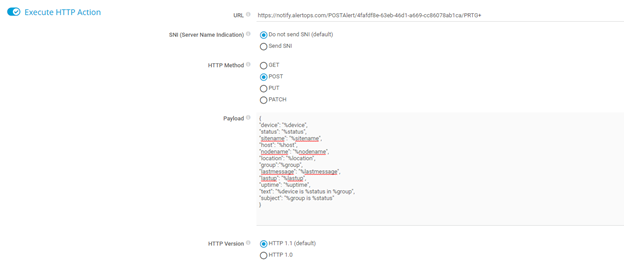
Step 5: Configure Notification Payload with the following JSON below
Payload:
{
"device": "%device",
"status": "%status",
"sitename": "%sitename",
"host": "%host",
"nodename": "%nodename",
"location": "%location",
"group":"%group",
"lastmessage": "%lastmessage",
"lastup": "%lastup",
"uptime": "%uptime",
"text": "%device is %status in %group",
"subject": "%group is %status"
}
Step 6: Define triggers for group or device using the notification you created above.

Alert Triggering Information
AlertOps will automatically create an incident when a new alert is received from PRTG with an IncidentStatus status of “Down.”
If an alert with status “Down” matches an existing Open Alert, AlertOps will recognize the new alert as a duplicate and ignore the alert. The alert will be recorded in the Inbound Messages table as “Mapped Appended.”
AlertOps will automatically close the same incident when an alert with an IncidentStatus status “Up” is received.
Testing and Troubleshooting
Click here to read about Web API Testing and Troubleshooting.
Rackspace
Rackspace Integration Guide
Rackspace Cloud Monitoring monitors websites and sends critical alerts, regardless of where the sites are hosted. Integrate AlertOps’ alert management platform with Rackspace to receive and respond to critical alerts through email, SMS, push notification, and phone alerts. AlertOps ensures that alerts received from Rackspace always reach the correct, available team member by utilizing escalation policies and on-call schedules.
AlertOps Configuration
- From the main menu, click on Integrations and then select Inbound Integrations from the sub menu.
- Select API tab
- Select the 'ADD API INTEGRATION' button.
- You should now be on the API Integration Detail page. Select Rackspace from the pre-built Integration Templates.
- Enter a name for the integration. Select an escalation rule to determine the integration's escalation policy. And, enter the names of recipient group(s) and recipient user(s). Click 'SAVE.' Then, click 'COPY URL' to copy the URL endpoint to be used in the Rackspace configuration.

Rackspace Configuration
Step 1: Refer to Documentation on Rackspace.
Sample Payload:
Typical payload:
{
"event_id": "acOne:enOne:alOne:chOne:1326910500000:WARNING",
"log_entry_id": "6da55310-4200-11e1-aaaf-cd4c8801b6b1",
"details": {
"target": null,
"timestamp": 1326905540481,
"metrics": {
"tt_firstbyte": {
"type": "I",
"data": 2,
"unit": "milliseconds"
},
"duration": {
"type": "I",
"data": 2,
"unit": "milliseconds"
},
"bytes": {
"type": "i",
"data": 17,
"unit": "bytes"
},
"tt_connect": {
"type": "I",
"data": 0,
"unit": "milliseconds"
},
"code": {
"type": "s",
"data": "200",
"unit": "unknown"
}
},
"state": "WARNING",
"status": "warn.",
"txn_id": "sometransaction",
"collector_address_v4": "127.0.0.1",
"collector_address_v6": null,
"observations": [
{
"monitoring_zone_id": "mzOne",
"state": "WARNING",
"status": "warn.",
"timestamp": 1326905540481,
"collectorState": "UP"
}
]
},
"entity": {
"id": "enOne",
"label": "entity one",
"ip_addresses": {
"default": "127.0.0.1"
},
"metadata": null,
"managed": false,
"uri": null,
"agent_id": null,
"created_at": 1326905540481,
"updated_at": 1326905540481
},
"check": {
"id": "chOne",
"label": "ch a",
"type": "remote.http",
"details": {
"url": "http://www.foo.com",
"body": "b",
"method": "GET",
"follow_redirects": true,
"include_body": false
},
"monitoring_zones_poll": [
"mzOne"
],
"timeout": 30,
"period": 60,
"target_alias": "default",
"target_hostname": "",
"target_resolver": "",
"disabled": false,
"metadata": null,
"confd_name": null,
"confd_hash": null,
"active_suppressions": null,
"scheduled_suppressions": null,
"created_at": 1326905540481,
"updated_at": 1326905540481
},
"alarm": {
"id": "alOne",
"label": "Alarm 1",
"check_id": "chOne",
"entity_id": "enOne",
"criteria": "if (metric[\"t\"] >= 2.1) { return WARNING } return WARNING",
"disabled": false,
"notification_plan_id": "npOne",
"metadata": null,
"confd_name": null,
"confd_hash": null,
"active_suppressions": null,
"scheduled_suppressions": null,
"created_at": 1326905540481,
"updated_at": 1326905540481
},
"tenant_id": "91111"
}
The following fields within the payload should be present:
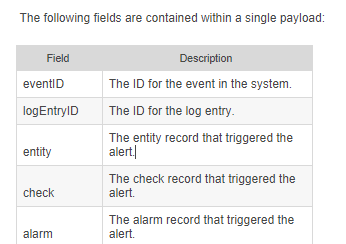

Click here and here to view documentation on notifications using webhooks and here on triggers and alarms.
Alert Triggering Information
AlertOps will automatically create an incident when a new alert is received from Rackspace with an IncidentStatus status of “CRITICAL,” “ERROR,” or “PROBLEM.”
If an alert with status “CRITICAL,” “ERROR,” or “PROBLEM” matches an existing Open Alert, AlertOps will recognize the new alert as a duplicate and ignore the alert. The alert will be recorded in the Inbound Messages table as “Mapped Appended.”
AlertOps will automatically close the same incident when an alert with an IncidentStatus status “OK” or “RESOLVED” is received.
Testing and Troubleshooting
Click here to read about Web API Testing and Troubleshooting.
RapidSpike
An advanced website monitoring platform for performance, security, and reliability.
AlertOps and RapidSpike
AlertOps’ alert management system can be integrated with RapidSpike to receive and respond to critical (predefined status mappings) uptime alerts through email, SMS, push notification or phone alerts. AlertOps would ensure that the alert would reach the appropriate team by using proper workflows, escalation policies and schedules. Based on your ruleset, incidents can be automatically opened and closed, depending on whether RapidSpike reports an uptime monitoring problem or a recovery.
The above scenario and scope for integration is since AlertOps has a very flexible and simple API/Webhook configuration feature that can be leveraged with RapidSpike’s monitoring and alerting capabilities.
AlertOps Inbound Integrations
We can define some rulesets in AlertOps so that RapidSpike can send out notifications to the AlertOps platform. AlertOps would ensure based on these notifications received, that it would always reach out and assign to the correct person/team by utilizing its escalation policies, schedules, and workflow features.
AlertOps provides Inbound Integrations to integrate with numerous monitoring, chat and ITSM tools. You can configure an inbound integration for RapidSpike incidents.
At a high level this is how the flow looks like, you define an API integration in the AlertOps platform by defining settings like Integration Name, Escalation rules, recipient users/groups. Once an integration is defined, a unique API URL is generated. This acts as webhook or the gateway through which notifications from RapidSpike reach AlertOps and thus an incident/alert is created correspondingly. The API can be defined with various settings like URL mappings, filters, escalations etc. as required.
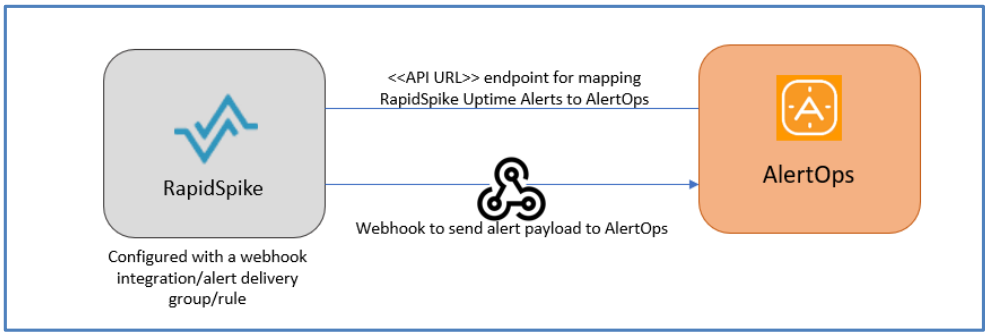
To configure an Inbound Integration in AlertOps to receive alerts from RapidSpike
- In the menu on left pane, select Integrations > Inbound Integrations > Add API Integration.
- There are numerous integration options available in AlertOps, select RapidSpike
- Once you select the integration, you can then specify basic settings like the integration name, escalation policy, names of the recipients/groups for which the alerts must be assigned to.
- Once you click save, the API Integration will be created, and you will be given a unique URL which acts as the access point and needs to be configured at the source (in this case RapidSpike), to send alerts. You can find the integration you just created, and you can give advanced settings and define various configurations for the alerts to be received and processed. For example, you can define when to open and close alerts based on the payload obtained from the API call, filters etc

- AlertOps automatically creates an alert when the status variable (monitors_0^state) is ‘failing’.The incident will also be closed automatically when the status ‘passing’ is received.
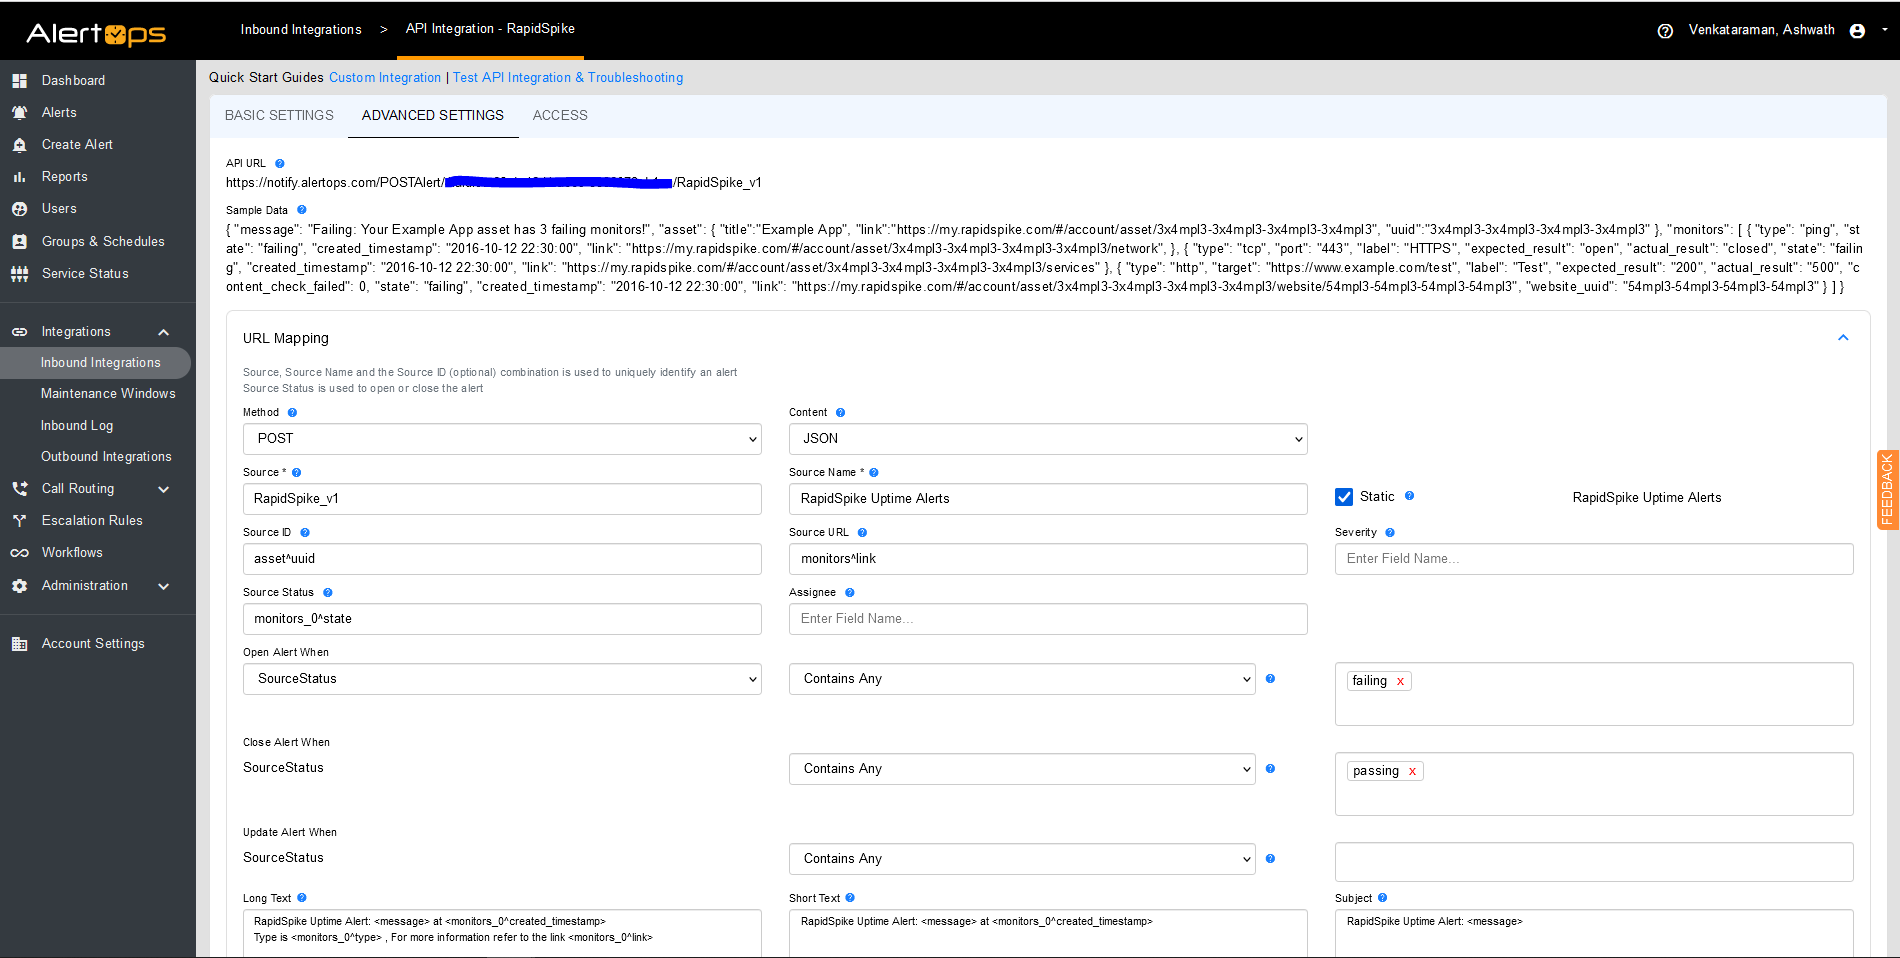
You can similarly define URL mappings as you want, owing to the flexibility provided by AlertOps’ OpenAPI integrations. You can provide other filters and match with regex expressions as well. You can also test the generated URL.
Configuration of RapidSpike for AlertOps Integration,
RapidSpike alerts and notifications allow you to set robust and configurable alerting policies that enable you to get notified about changes or issues affecting your website/server’s uptime. For more information refer to the links in the Reference section. You need to define Alert delivery groups and attach it to an uptime rule.
To setup an Integration Webhook to send out alerts to AlertOps,
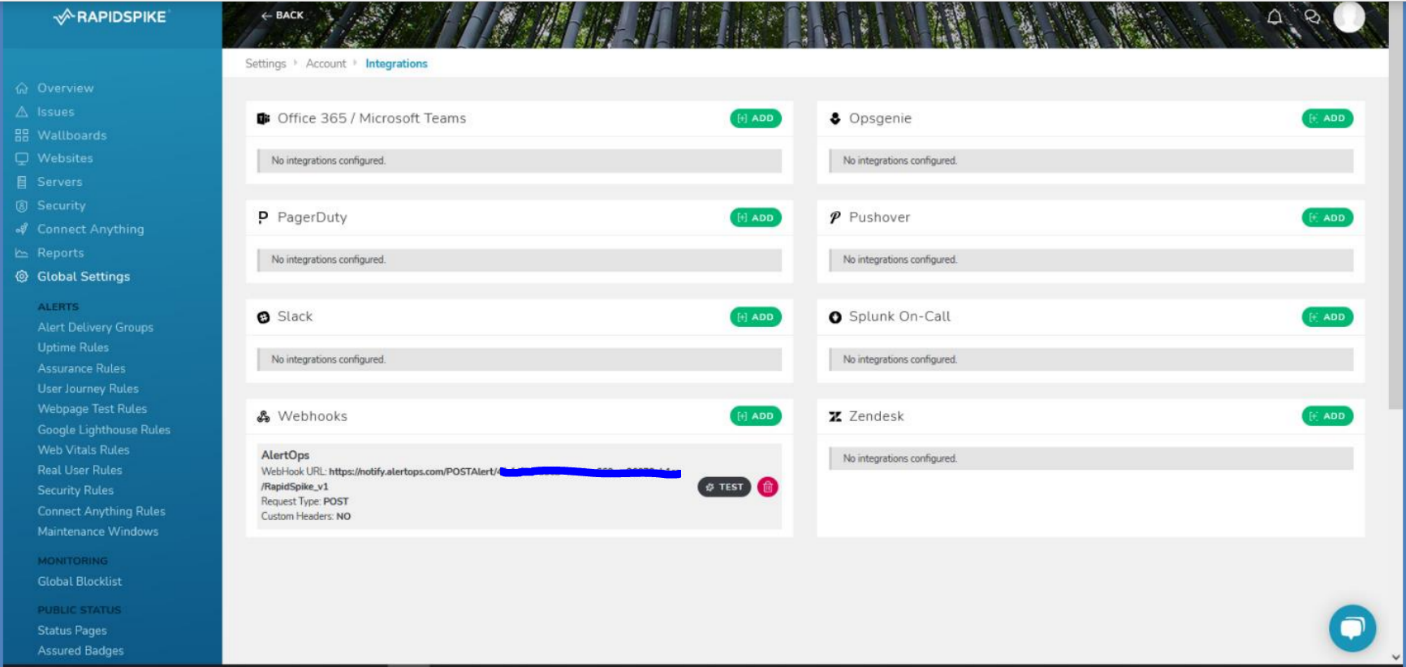
- In the left navigation tab of your RapidSpike dashboard, under Global Settings and Account, select ‘Integrations’.
- Select ‘Add’ under Webhooks. Give a label, paste the API URL which you obtained in the previous section and select the Request Type as POST. You can provide custom headers if any. Click Add. You can test by sending a sample alert to AlertOps.
To define Alert Delivery Groups and Alert Rules for Uptime,
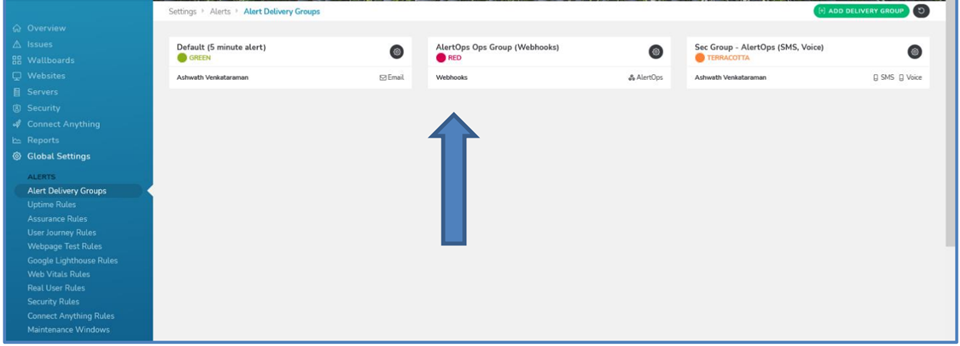
- Alert Delivery Groups serve to define various ways in which one can get notified and how. For example, you can have one delivery group for one team associated with a method of delivery, and another delivery group for another team with another method of delivery Each group can be colour coded for discerning different types of alerts and notification methods.
- Under Global Settings and under Alerts, select Alert Delivery Groups > ‘Add Delivery Group’, give a label, assign sensitivity, color and notification methods. Click Update. (Under Webhooks make sure you select the Webhook which you defined in the previous step)
- Under Alerts select Uptime Rules. Find the website or server you might have created in RapidSpike (or any other configuration you might have done), click ‘Add Rule’. Under Delivery Groups make sure you select the group/groups which you defined in the previous step.

You have created a Webhook Integration, Alert Delivery Group and an Uptime Alert Rule, that would send out notifications to AlertOps when the alert condition is triggered (in this case when there is a problem in Uptime monitoring of the server/website)
Alerts in AlertOps can be seen in the "Inbound Log" or "Alerts" section in your AlertOps environment.

Alert Triggering Information:
AlertOps will automatically create an incident when a new alert is received from RapidSpike when the monitors_0^state field contains “failing”.
If an alert with status “failing” matches an existing Open Alert, AlertOps will recognize the new alert as a duplicate and ignore the alert. The alert will be recorded in the Inbound Messages table as “Mapped Appended.”
AlertOps will automatically close the same incident when an alert with monitors_0^state contains “passing”.
References
RapidSpike Alerts and Notifications
Quickbase
A low-code platform for developing apps, integrations, and workflow orchestrations.
AlertOps and Quickbase
AlertOps’ alert management system can be integrated with Quickbase to receive and respond to critical alerts/incidents through email, SMS, push notification or phone alerts. AlertOps would ensure that the alert would reach the appropriate team by using proper workflows, escalation policies and schedules. Based on your ruleset, incidents can be automatically opened and closed, depending on what change Quickbase reports.
The above scenario and scope for integration is since AlertOps has a very flexible and simple API/Webhook configuration feature that can be leveraged with Quickbase’s app change and notification capabilities. We can ideally share incidents to AlertOps for specific trigger conditions like, when an app record has been replaced, added, deleted, or modified.
AlertOps - Inbound Integration
We can define rulesets in AlertOps so that Quickbase can send out notifications to the AlertOps platform. AlertOps would ensure based on these notifications received, that it would always reach out and assign to the correct person/team by utilizing its escalation policies, schedules, and workflow features.
AlertOps provides Inbound Integrations to integrate with numerous monitoring, chat and ITSM tools. You can configure an inbound integration for Quickbase app events. AlertOps provides so many flexible options for integrating and mapping as and how you want.
At a high level this is how the flow looks like, you define an API integration in the AlertOps platform by defining settings like Integration Name, Escalation rules, recipient users/groups. Once an integration is defined, a unique API URL is generated. This acts as webhook or the gateway through which notifications from Quickbase reach AlertOps and thus an incident/alert is created correspondingly. The API can be defined with various settings like URL mappings, filters, escalations etc. as required. Quickbase should be setup with a Webhook and a message body.

To configure a Quickbase API Integration in AlertOps,
- In the menu on left pane, select Integrations > Inbound Integrations > Add API Integration.
- There are numerous integration options available in AlertOps, select Quickbase.
- You can then specify basic settings like the integration name, escalation policy, names of the recipients/groups for which the alerts must be assigned to.
- On clicking SAVE, the API Integration will be created, and you will be given a unique URL which acts the access point and needs to be configured at the source (in this case Quickbase), to send alerts. You can find the integration you just created, and you can give advanced settings and define various configurations for the alerts to be received and processed. For example, you can define when to open and close alerts based on the response obtained from the API call, filters etc.
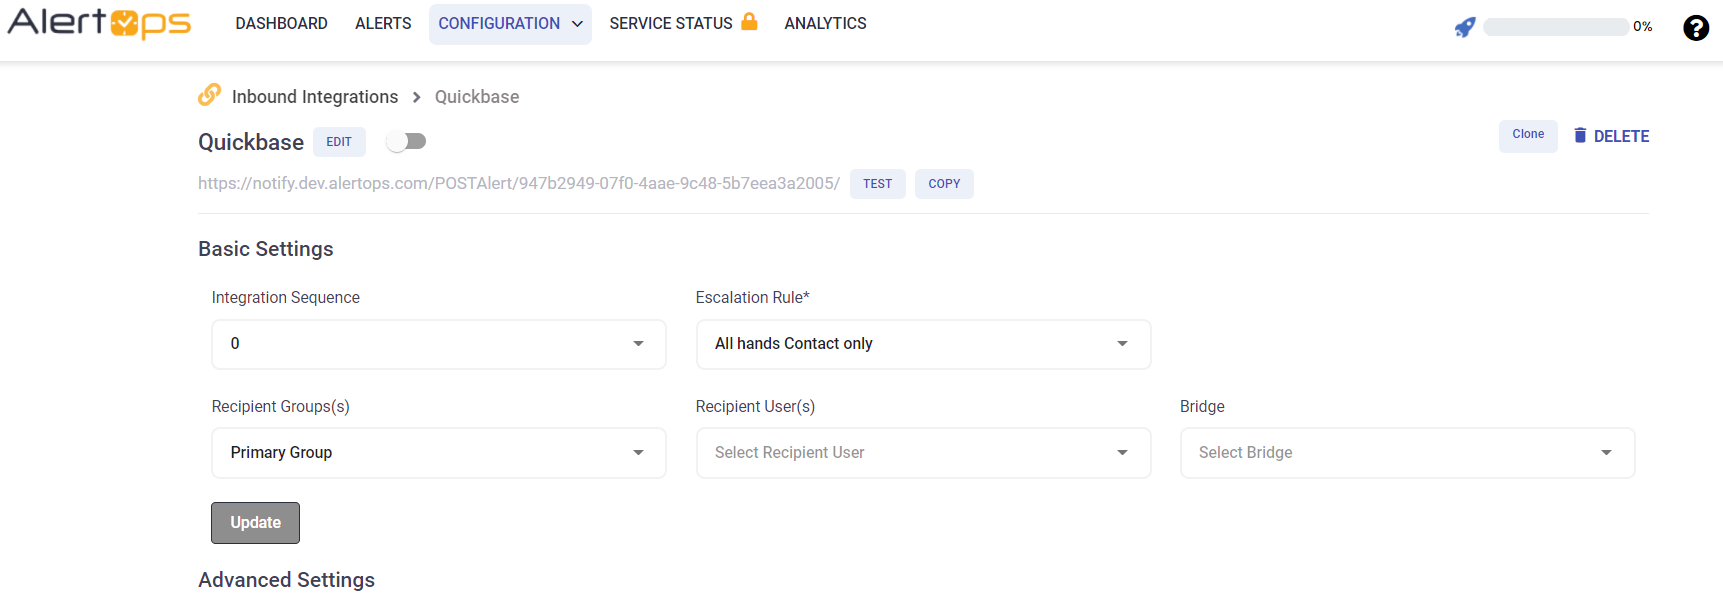
- Make a note of the API URL, which will be used in Quickbase, so it calls a HTTP POST request to this URL with the body in JSON format containing the alert specific information. AlertOps automatically creates an alert when the status variable (recordChange) contains the values -'Add/Replace/Delete'. The incident will also be closed automatically when the recordChange other than ‘Add/Replace/Delete’ is received.
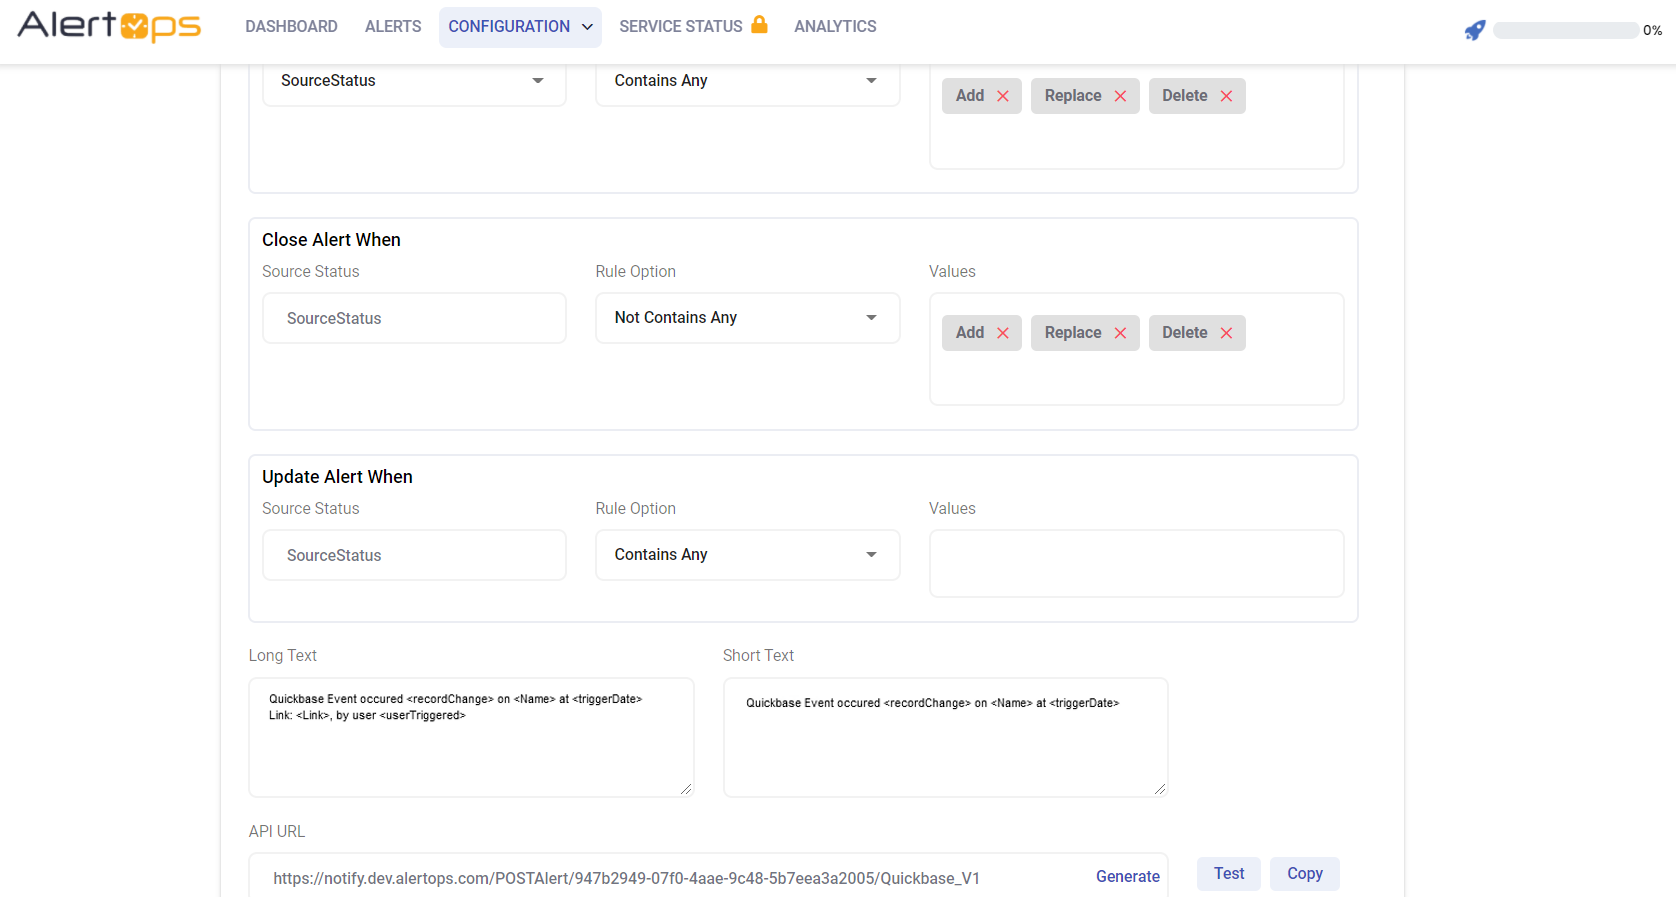
- You can similarly define URL mappings as you want, owing to the flexibility provided by AlertOps’ Open API integrations. You can provide other filters and match with regex expressions as well. You can also test the generated URL.
Configuration of Quickbase for AlertOps Integration
We can now define configurations in Quickbase to access this API and send out events to AlertOps.
To create a Webhook in Quickbase,
- In your Quickbase portal, select your app under ‘My Apps’ and then select the Table for which you want to configure the Webhook for.
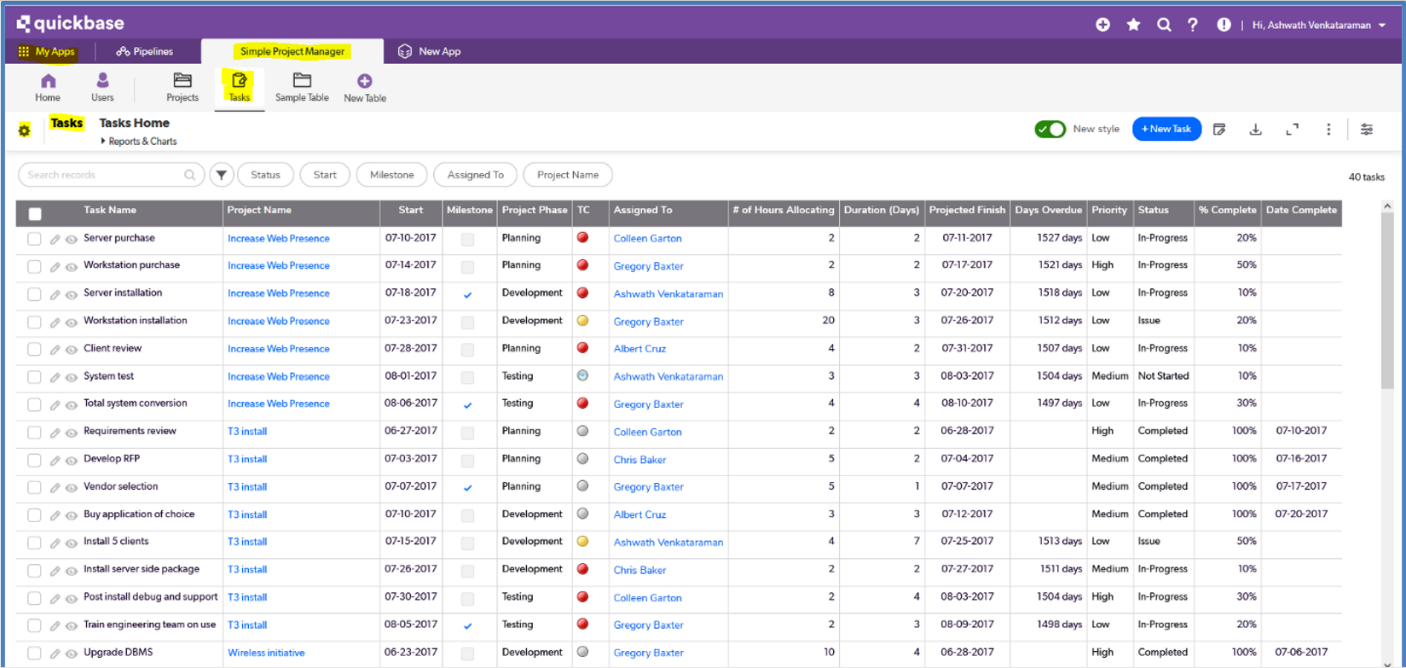
- There is a settings icon in the corner, to the left of your Table name. Select that. Under ‘Workflows & Permissions’ select Webhooks and select ‘+New Webhook’.
- Give a name/description, and add criteria as ‘modified, added or deleted’. You can also provide additional criteria. But make sure it is mapped accordingly in AlertOps under URL Mapping.
- Provide the Endpoint URL as the URL which you obtained after creating the inbound integration in AlertOps, HTTP method as POST and Message format as JSON.
- Under Message Body, give the following:
{"name":"%appName%","appID":"%appid%", "tableID":"%dbid%","recordChange":"%action%","Link":"%reclink%","triggerDate":"%curdate%","userTriggered":"%curuser%","priorityField":"[Priority]","statusField":"[Status]","WebhookID":"%webhookid%"}
- The above markers are mandatory for the integration to work; you can add additional fields if needed and map accordingly.
- Click Save. Make sure the Webhook is activated.
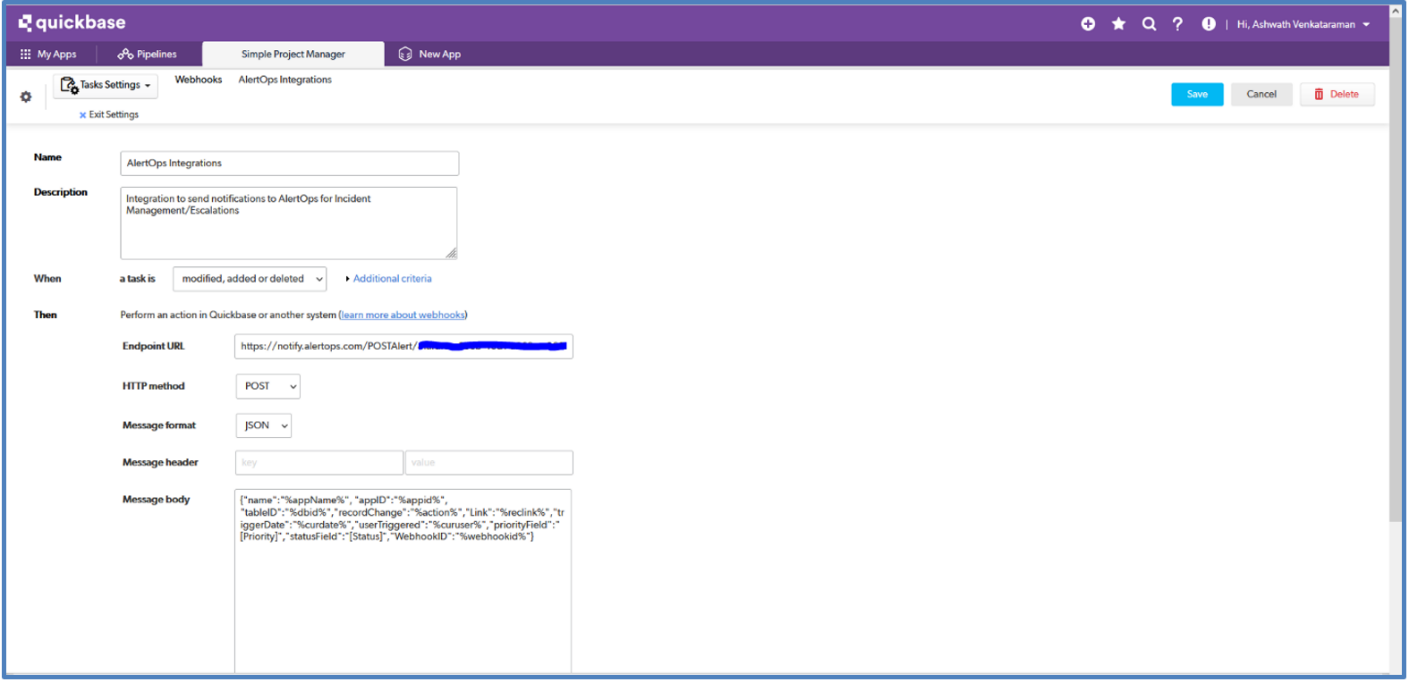
You have created an integration with AlertOps, so Quickbase App record change events are sent to AlertOps for advanced incident management.
Message logs, alert specific information can be viewed in the “Inbound Log” section in AlertOps Dashboard. Alerts can be viewed in the ‘Alerts’ tab as well.
Alert Triggering Information:
AlertOps will automatically create an incident when a new alert is received from Quickbase when the recordChange field contains “Add/Replace/Delete”
If an alert with status “Add/Replace/Delete” matches an existing Open Alert, AlertOps will recognize the new alert as a duplicate and ignore the alert.
The alert will be recorded in the Inbound Messages table as “Mapped Appended.”
AlertOps will automatically close the same incident when an alert with recordChange does not contain ‘Add/Delete/Replace’.
References
Quickbase Markers, User Tokens, Fields
Runscope
Runscope Integration Guide
Runscope is a set of API debugging and testing tools. Developers and operations teams can use Runscope Radar to monitor their APIs via scheduled test. Integrate AlertOps’ alert management platform with Runscope to receive and respond to critical alerts through email, SMS, push notification, and phone alerts. AlertOps ensures that alerts received from Runscope always reach the correct, available team member by utilizing escalation policies and on-call schedules.
AlertOps Configuration
- From the main menu, click on Integrations and then select Inbound Integrations from the sub menu.
- Select API tab
- Select the 'ADD API INTEGRATION' button, you should now be on the API Integration Detail page.
- Select Runscope from the pre-built Integration Templates.
- Enter a name for the integration. Select an escalation rule to determine the integration's escalation policy.
- Enter the names of recipient group(s) and recipient user(s).
- Click 'SAVE.' Then, click 'COPY URL' to copy the URL endpoint to be used in the Runscope configuration.

Runscope Configuration
Step 1: Create a webhook in Runscope

Alert Triggering Information
AlertOps will automatically create an incident when a new alert is received from Runscope with an IncidentStatus status of “fail.”
If an alert with status “fail” matches an existing Open Alert, AlertOps will recognize the new alert as a duplicate and ignore the alert. The alert will be recorded in the Inbound Messages table as “Mapped Appended.”
AlertOps will automatically close the same incident when an alert with an IncidentStatus status “pass” is received.
Testing and Troubleshooting
Click here to read about Web API Testing and Troubleshooting.


