Nagios (API)
- 12 May 2023
- 5 Minutes to read
- Print
- DarkLight
- PDF
Nagios (API)
- Updated on 12 May 2023
- 5 Minutes to read
- Print
- DarkLight
- PDF
Article summary
Did you find this summary helpful?
Thank you for your feedback!
AlertOps and Nagios
AlertOps’ alert management system can be integrated with Nagios to receive and respond to critical alerts through email, SMS, push notification or phone alerts. AlertOps would ensure that the alert would reach the appropriate team by using proper workflows, escalation policies and schedules. Based on your ruleset, incidents can be automatically opened and closed, depending on whether Nagios reports a problem or a recovery.
The above scenario and scope for integration is due to the fact that AlertOps has a very flexible and simple API/Webhook configuration feature that can be leveraged with Nagios’ monitoring and notification capabilities.
AlertOps – Inbound Integrations
We can define rulesets in AlertOps so that Nagios can send out notifications to the AlertOps platform. AlertOps would ensure based on these notifications received, that it would always reach out and assign to the correct person/team by utilizing its escalation policies, schedules, and workflow features.
AlertOps provides Inbound Integrations to integrate with numerous monitoring, chat and ITSM tools. You can configure a custom inbound integration for Nagios services and hosts. In this example configuration we will define a single API endpoint. AlertOps provides so many flexible options for integrating and mapping as and how you want. (There is an email-based Nagios integration option available in AlertOps)
At a high level this is how the flow looks like, you define an API integration in the AlertOps platform by defining settings like Integration Name, Escalation rules, recipient users/groups. Once an integration is defined, a unique API URL is generated. This acts as webhook or the gateway through which notifications from Nagios reach AlertOps and thus an incident/alert is created correspondingly. The API can be defined with various settings like URL mappings, filters, escalations etc. as required. Nagios should be defined with a command object to send out a POST request to the HTTPS endpoint defined here.

Configure Inbound Integration in AlertOps
- Navigate to Configuration àIntegrations àAdd API Integration à API Integration Detail page.
- Select Nagios
- You can configure the integration for Hosts or Services separately or a single endpoint for both. Nagios hosts open and close alerts in AlertOps based on the values DOWN and UP respectively, received from Nagios. Services open and close alerts based on the values CRITICAL and OK respectively. Advanced configuration settings can be defined to create specific alerts and incidents for different states received from Nagios. Here we will have an API that will open alerts based on states received from either hosts or services (a single endpoint).
- You can then specify basic settings like the integration name, escalation policy, names of the recipients/groups for which the alerts must be assigned to (screenshot below).
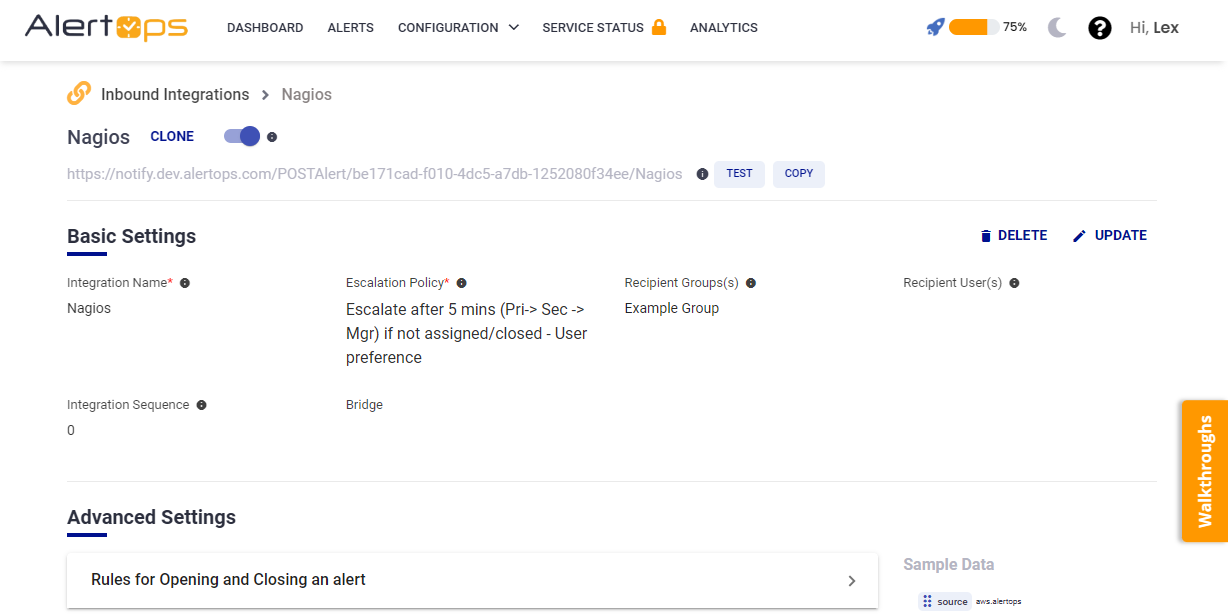
- On clicking Submit, the API Integration will be created, and you will be given a unique URL which acts the access point and needs to be configured at the source (in this case Nagios), to send alerts. You can find the integration you just created, and you can give advanced settings and define various configurations for the alerts to be received and processed. For example, you can define when to open and close alerts based on the response obtained from the API call, filters etc.
- Make a note of the API URL, which will be used in the Nagios configuration script, so the script executes and calls a HTTP request to this URL with the body in JSON format containing the host/service specific information.
Configure Integration in Nagios
Now that we have setup AlertOps with the Nagios API Inbound Integration, along with a unique API URL; we can now define configurations in Nagios to access this API Webhook and send out notifications to AlertOps.
The host and service config objects are to be attached to a contact called “AlertOps” and a contact group called “AlertOps_group1”, which are again defined as contact objects attached to notification command objects. Make sure you add the above contact and contact groups to the host and service objects you define. The following set of instructions assumes you have created the host and service objects with the necessary contact information macros.
- Open the file “contacts.cfg” and paste the contact object configuration as shown below in the screenshot. Paste the following contact group configuration below it. You can define contacts and groups however you want. Save the file.

define contactgroup{
        contactgroup_name       AlertOps_group1
        alias                               AOAlias
        members                       AlertOps
}
2. Now open “commands.cfg” and paste the following, (we would have defined host and service command names in the contact object in the previous step)
define command{
  command_name  notify-host-by-https
  command_line  /bin/bash /usr/local/scripts/alertops_script.sh "$HOSTNAME$" "$HOSTSTATE$" "$HOSTADDRESS$" "$HOSTOUTPUT$" "$LONGDATETIME$" "$NOTIFICATIONTYPE$" "Subject: $HOSTNAME$ is $HOSTSTATE$"
}

define command{
  command_name  notify-service-by-https
  command_line  /bin/bash /usr/local/scripts/alertops_script.sh "$SERVICEDESC$" "$SERVICESTATE$" "$HOSTADDRESS$" "$SERVICEOUTPUT$" "$LONGDATETIME$" "$NOTIFICATIONTYPE$" "Subject: $SERVICEDESC$ is $SERVICESTATE$"
}
3. We have two notification commands that call a shell script along with the Nagios service/host macros as arguments. Alternatively, you can call a CURL command here directly to access the AlertOps/Nagios API endpoint. Save the file.
4. Now navigate to /usr/local/scripts/. Create the folder ‘scripts’ if it is not there. Inside scripts create a file “alertops_script.sh” and paste the following contents:
#!/bin/bash
host_name=$1
status=$2
hosturl=$3
time=$5
subj=$7
comm=$6
ipv=$4
jsonpayload="{\"source\":\"$host_name\",\"timestamp\":\"$time\",\"URL\":\"$hosturl\",\"status\":\"$status\",\"subject\":\"$subj\",\"desc\":\"$ipv\",\"type\":\"$comm\"}"
CT="Content-Type: application/json"
URL="https://notify.alertops.com/POSTAlert/YOUR ENDPOINT /nagios"
response=$(curl -X POST -H "$CT" -d "$jsonpayload" "$URL")
echo $response
5. It is important that the host object and the service object has the following field – “notifications_enabled 1”. This will make sure that notifications are enabled for this configuration. If this does not work (somehow notifications are not enabled), then go to the web console. In the left navigation pane, select Hosts, select the host you configured, here it is “aws.alertops”.
6. You can view the host state information and in the right side there is a box of ‘Host Commands’.

7. Host commands can be configured directly from the Nagios Web console. Select “Enable notifications for all services on a host”. In the next page check the option that says “Enable for Host too” – Click Commit.
8. Message logs, alert specific information can be viewed in the “Inbound Log”/"Alerts" section in AlertOps.

Alert Triggering Information:
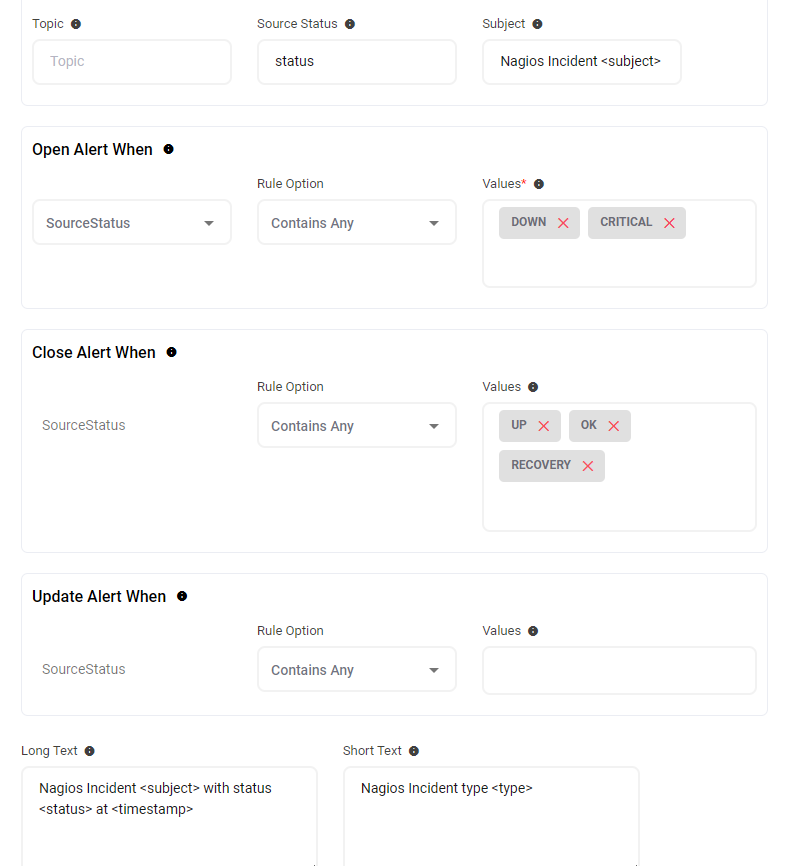
AlertOps will automatically create an incident when a new alert is received from Nagios when the status field contains “CRITICAL” or “DOWN”.
If an alert with status “CRITICAL” or “DOWN” matches an existing Open Alert, AlertOps will recognize the new alert as a duplicate and ignore the alert. The alert will be recorded in the Inbound Messages table as “Mapped Appended.”
AlertOps will automatically close the same incident when an alert with status contains “UP”,”OK” or “RECOVERY”.
References:
Was this article helpful?