Incinga1
- 11 May 2023
- 5 Minutes to read
- Print
- DarkLight
- PDF
Incinga1
- Updated on 11 May 2023
- 5 Minutes to read
- Print
- DarkLight
- PDF
Article summary
Did you find this summary helpful?
Thank you for your feedback!
Icinga1 is an open-source monitoring system used to monitor the health of networked hosts and services. It is a fork of Nagios and checks the availability of your network resources, notifies users of outages,should things go bad and notify again if they recover. Hosts and services can be virtually anything, which can be checked in some way –HTTP, SSH, SMTP, ICMP, PING4, processor load, disk usage etc.
AlertOps and Icinga1
AlertOps’ alert management system can be integrated with Icinga1 to receive and respond to all (predefined status mappings) alerts through email, SMS, push notification or phone alerts. AlertOps would ensure that the alert/job status would reach the appropriate team by using proper workflows, escalation policies and schedules. Based on your ruleset, incidents can be automatically opened and closed, depending on whether Icinga1 reports an error or a recovery.
The above scenario and scope for integration is due to the fact that AlertOps has a very flexible and simple API/Webhook configuration feature that can be leveraged with Icinga's monitoring and notification capabilities.
AlertOps - Inbound Integration
You can define rulesets in AlertOps so that Icinga1 can send out notifications to the AlertOps platform. AlertOps would ensure based on these notifications received, that it would always reach out and assign to the correct person/team by utilizing its escalation policies, schedules, and workflow features.
AlertOps provides Inbound Integrations to integrate with numerous monitoring, chat and ITSM tools. You can configure an inbound integration for Icinga1 services and hosts (a common integration for both in this case). In this example configuration we will define a single API endpoint. AlertOps provides so many flexible options for integrating and mapping as and how you want.
At a high level this is how the flow looks like, you define an API integration in the AlertOps platform by defining settings like Integration Name, Escalation rules, recipient users/groups. Once an integration is defined, a unique API URL is generated. This acts as webhook or the gateway through which notifications from Icinga reach AlertOps and thus an incident/alert is created correspondingly. The API can be defined with various settings like URL mappings, filters, escalations etc. as required. Icinga should be defined with a command object to send out a POST request to the HTTPS endpoint defined here.

Configure Inbound Integration in AlertOps
- Navigate to Configuration àIntegrations àAdd API Integration à API Integration Detail page.
- Select Icinga1
- Once you select the integration, you can then specify basic settings like the integration name, escalation policy, names of the recipients/groups for which the alerts must be assigned to.
- Once you click save, the API Integration will be created, and you will be given a unique URL which acts as the access point and needs to be configured at the source (in this case Icinga1), to send alerts. You can find the integration you just created, and you can give advanced settings and define various configurations for the alerts to be received and processed. For example, you can define when to open and close alerts based on the payload obtained from the API call, filters etc.
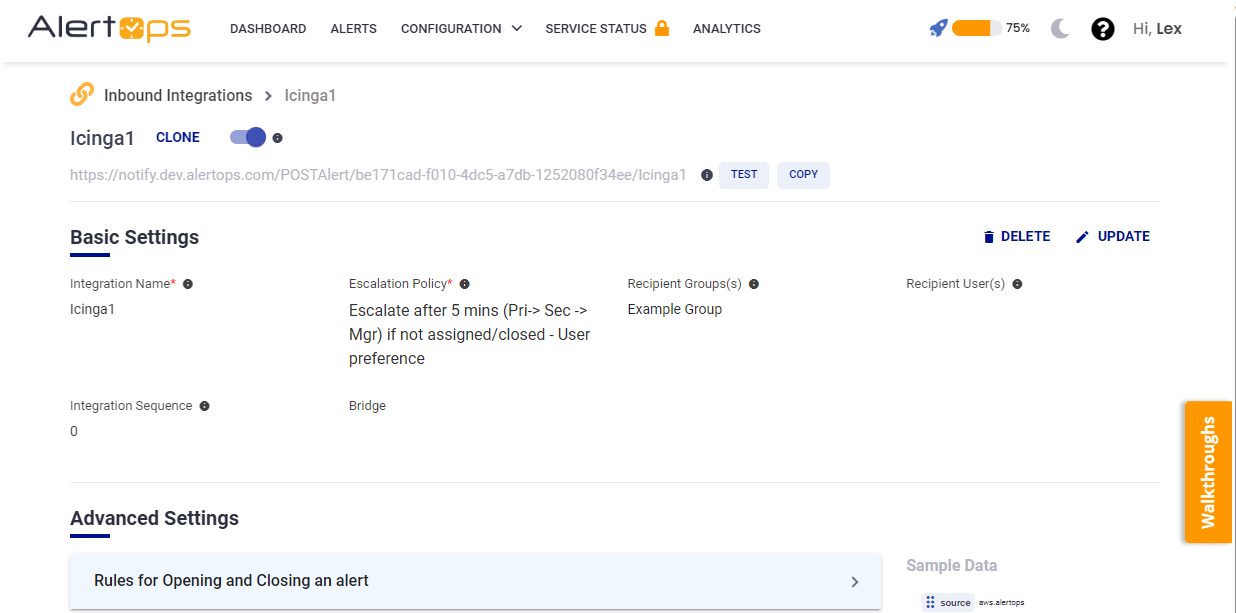
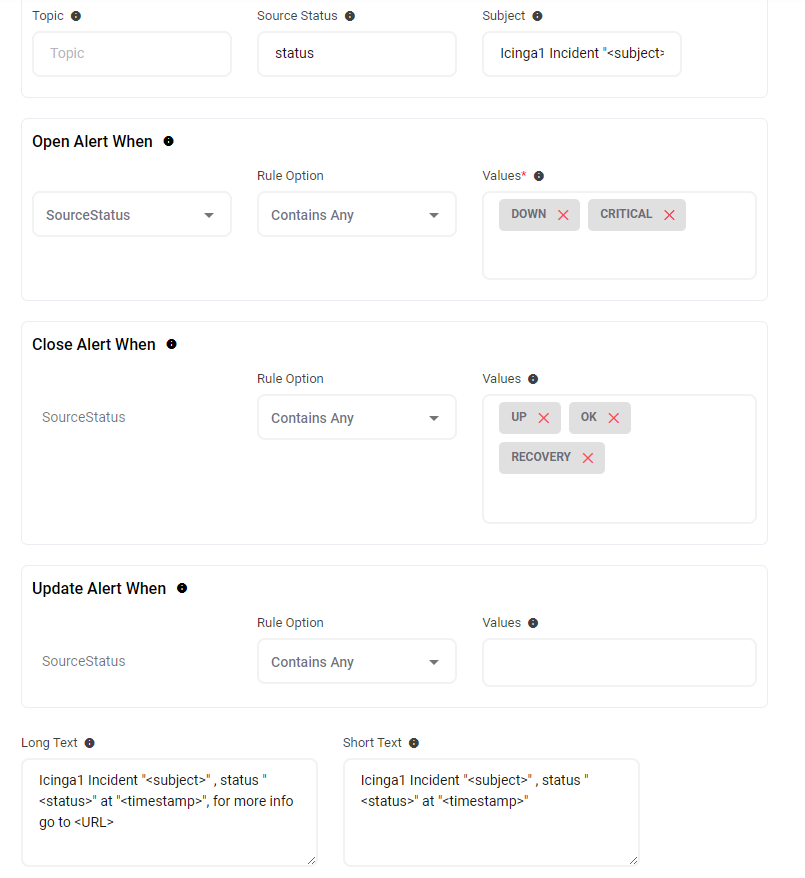
- Make a note of the API URL, which will be used in Icinga1, so it calls a HTTP POST request to this URL with the body in JSON format containing the alert specific information. AlertOps automatically creates an alert when the status variable (status) contains 'DOWN'/'CRITICAL'. The incident will also be closed automatically when the status 'UP' or 'OK' or 'RECOVERY' is received from Icinga1
- You can similarly define URL mappings as you want, owing to the flexibility provided by AlertOps’ OpenAPI/Plug-and-Play integrations. You can provide other filters and match with regex expressions as well. You can also test the generated URL with the sample data provided
Configure Integration in Icinga1
- Let’s take an example where we monitor a host (in this case an AWS EC2 instance), and a service object to check its PING information. These objects are attached to a contact called “AlertOps” and a contact group called “AlertOps_group1”, which are again defined as contact objects attached to notification command objects.
- This is just a sample/example configuration. You can write the command script, notification criteria however you want.
- In the Linux system where Icinga is setup, go to terminal with sudo access, navigate to /usr/local/Icinga/etc/objects (or alternatively /etc/icinga/objects). Create an config file called aws.alertops.cfg (any name for the host monitored)
- When you define the host and service object, make sure the following fields are defined, ‘notification_period, notification_interval, notification_options, contact_groups, contacts and notifications_enabled’. The configuration is given in the screenshots.
- Now open the file “contacts.cfg” and configure the contact object configuration that is provided in the screenshot. Paste the following contact group configuration below it. You can define contacts and groups however you want. Just make sure, it is named accordingly in the host and service object. Save the file.


- Now open “commands.cfg” and paste the following, (we would have defined host and service command names in the contact object in the previous step)
define command{
  command_name  notify-host-by-https
  command_line  /bin/bash /usr/local/scripts/alertops_script.sh "$HOSTNAME$" "$HOSTSTATE$" "$HOSTADDRESS$" "$HOSTOUTPUT$" "$LONGDATETIME$" "$NOTIFICATIONTYPE$" "Subject: $HOSTNAME$ is $HOSTSTATE$"
}

define command{
  command_name  notify-service-by-https
  command_line  /bin/bash /usr/local/scripts/alertops_script.sh "$SERVICEDESC$" "$SERVICESTATE$" "$HOSTADDRESS$" "$SERVICEOUTPUT$" "$LONGDATETIME$" "$NOTIFICATIONTYPE$" "Subject: $SERVICEDESC$ is $SERVICESTATE$"
}
We have two notification commands that call a shell script along with the Icinga1 service/host macros as arguments. Alternatively, you can call a CURL command here directly to access the AlertOps/Icinga1 API endpoint. Save the file.
7. Now navigate to /usr/local/scripts/. Create the folder ‘scripts’ if it is not there. Inside scripts create a file “alertops_script.sh” and paste the following contents (make sure you paste the API URL),
#!/bin/bash
host_name=$1
status=$2
hosturl=$3
time=$5
subj=$7
comm=$6
ipv=$4
jsonpayload="{\"source\":\"$host_name\",\"timestamp\":\"$time\",\"URL\":\"$hosturl\",\"status\":\"$status\",\"subject\":\"$subj\",\"desc\":\"$ipv\",\"type\":\"$comm\"}"
CT="Content-Type: application/json"
URL="<API URL WHICH YOU OBTAIN IN THE INBOUND INTEGRATION CONFIG> "
response=$(curl -X POST -H "$CT" -d "$jsonpayload" "$URL")
echo $response
8. It is important that the host object and the service object has the following field – “notifications_enabled 1”. This will make sure that notifications are enabled for this configuration. If this does not work (somehow notifications are not enabled), then go to the web console. In the left navigation pane, select Host Detail, select the host you configured.
9. You can view the host state information and in the right side there is a box of ‘Host Commands’.
10. Host commands can be configured directly from the Icinga1 Web console. Select “Enable notifications for all services on a host”. In the next page check the option that says “Enable for Host too” – Click Commit. (You need to have external commands enabled for this)
11. You have enabled notifications for your Icinga1 host/service configuration. Now when the host instance enters any problem state (DOWN, CRITICAL), a notification would be sent via the shell script we defined, to AlertOps for incident management.
Message logs, alert specific information can be viewed in the “Inbound Log” section in AlertOps Dashboard. Alerts can be viewed in the ‘Alerts’ tab as well.
Alert Triggering Information
AlertOps will automatically create an incident when a new alert is received from Icinga1 when the status field contains "DOWN" or "CRITICAL".
If an alert with status "DOWN" or "CRITICAL" matches an existing Open Alert, AlertOps will recognize the new alert as a duplicate and ignore the alert.
The alert will be recorded in the Inbound Messages table as “Mapped Appended.”
AlertOps will automatically close the same incident when an alert with status contains 'UP/OK/RECOVERY'.
References
Was this article helpful?