Grafana
- 19 Nov 2025
- 2 Minutes to read
- Print
- DarkLight
- PDF
Grafana
- Updated on 19 Nov 2025
- 2 Minutes to read
- Print
- DarkLight
- PDF
Article summary
Did you find this summary helpful?
Thank you for your feedback!
Grafana Integration Guide
Grafana is a data visualization & monitoring application with support for many databases. Integrate AlertOps’ alert management platform with Grafana to receive and respond to critical alerts through email, SMS, push notification, and phone alerts. AlertOps ensures that alerts received from Grafana always reach the correct, available team member by utilizing escalation policies and on-call schedules.
AlertOps Configuration
- Navigate to Configuration àIntegrations àAdd API Integration à API Integration Detail page
- Select Grafana from the pre-built Integration Templates.
- Enter a name for the integration. Select an escalation rule to determine the integration's escalation policy.
- Enter the names of recipient group(s) and recipient user(s).
- Click 'SAVE.' Then, click 'COPY URL' to copy the URL endpoint to be used in the Grafana configuration.
- Under Advanced Settings in 'Rules for Opening and Closing an Alert' we need modify the mappings for Grafana's new default webhook payload. Add the following mappings,
Source Id: groupKey (this is used to uniquely identify an alert, and will be the dedup key for the alert - feel free to edit this based on what you think is the best dedup key for the alert)
Source Url: alerts_0^generatorURL
Source Status: state
Subject: <title> - <alerts_0^labels^alertname>
Open Alert When: Firing, [Alerting], alerting
Close Alert When: [OK], Normal, normal, ok
Update Alert When (optional) : [Pending], Pending
Long Text: Alert status: <status>
<title>
<message> | <alerts_0^generatorURL>
Short Text: <title> | <alerts_0^labels^alertname> | <state>
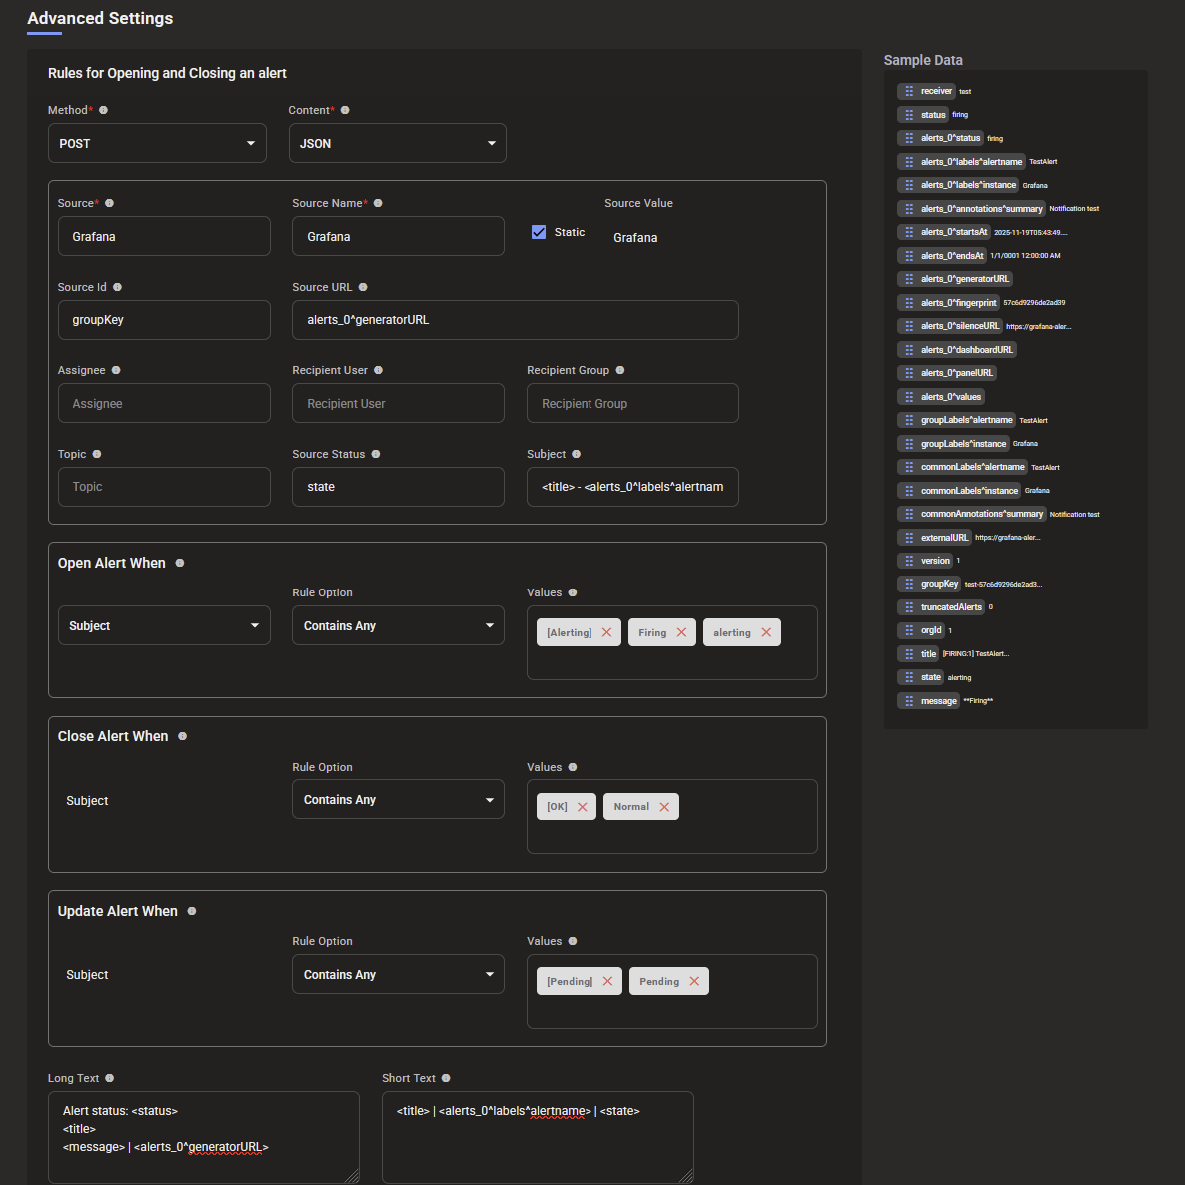
Paste the following under 'Sample Data' and select the Green Check mark and save,
{
"receiver": "test",
"status": "firing",
"alerts": [
{
"status": "firing",
"labels": {
"alertname": "TestAlert",
"instance": "Grafana"
},
"annotations": {
"summary": "Notification test"
},
"startsAt": "2025-11-19T05:43:49.508728175Z",
"endsAt": "0001-01-01T00:00:00Z",
"generatorURL": "",
"fingerprint": "57c6d9296de2ad39",
"silenceURL": "https://grafana-alertmanager-prod-us-east-2.grafana.net/alertmanager/alerting/silence/new?alertmanager=grafana&matcher=alertname%3DTestAlert&matcher=instance%3DGrafana",
"dashboardURL": "",
"panelURL": "",
"values": null,
"valueString": "[ metric='foo' labels={instance=bar} value=10 ]"
}
],
"groupLabels": {
"alertname": "TestAlert",
"instance": "Grafana"
},
"commonLabels": {
"alertname": "TestAlert",
"instance": "Grafana"
},
"commonAnnotations": {
"summary": "Notification test"
},
"externalURL": "https://grafana-alertmanager-prod-us-east-2.grafana.net/alertmanager",
"version": "1",
"groupKey": "test-57c6d9296de2ad39-1763531029",
"truncatedAlerts": 0,
"orgId": 1,
"title": "[FIRING:1] TestAlert Grafana ",
"state": "alerting",
"message": "**Firing**"
}
Grafana Configuration
Step 1: Select Alerting (under Alerts and IRM) from the Grafana Main Menu and select Contact Points, click on Create Contact Point.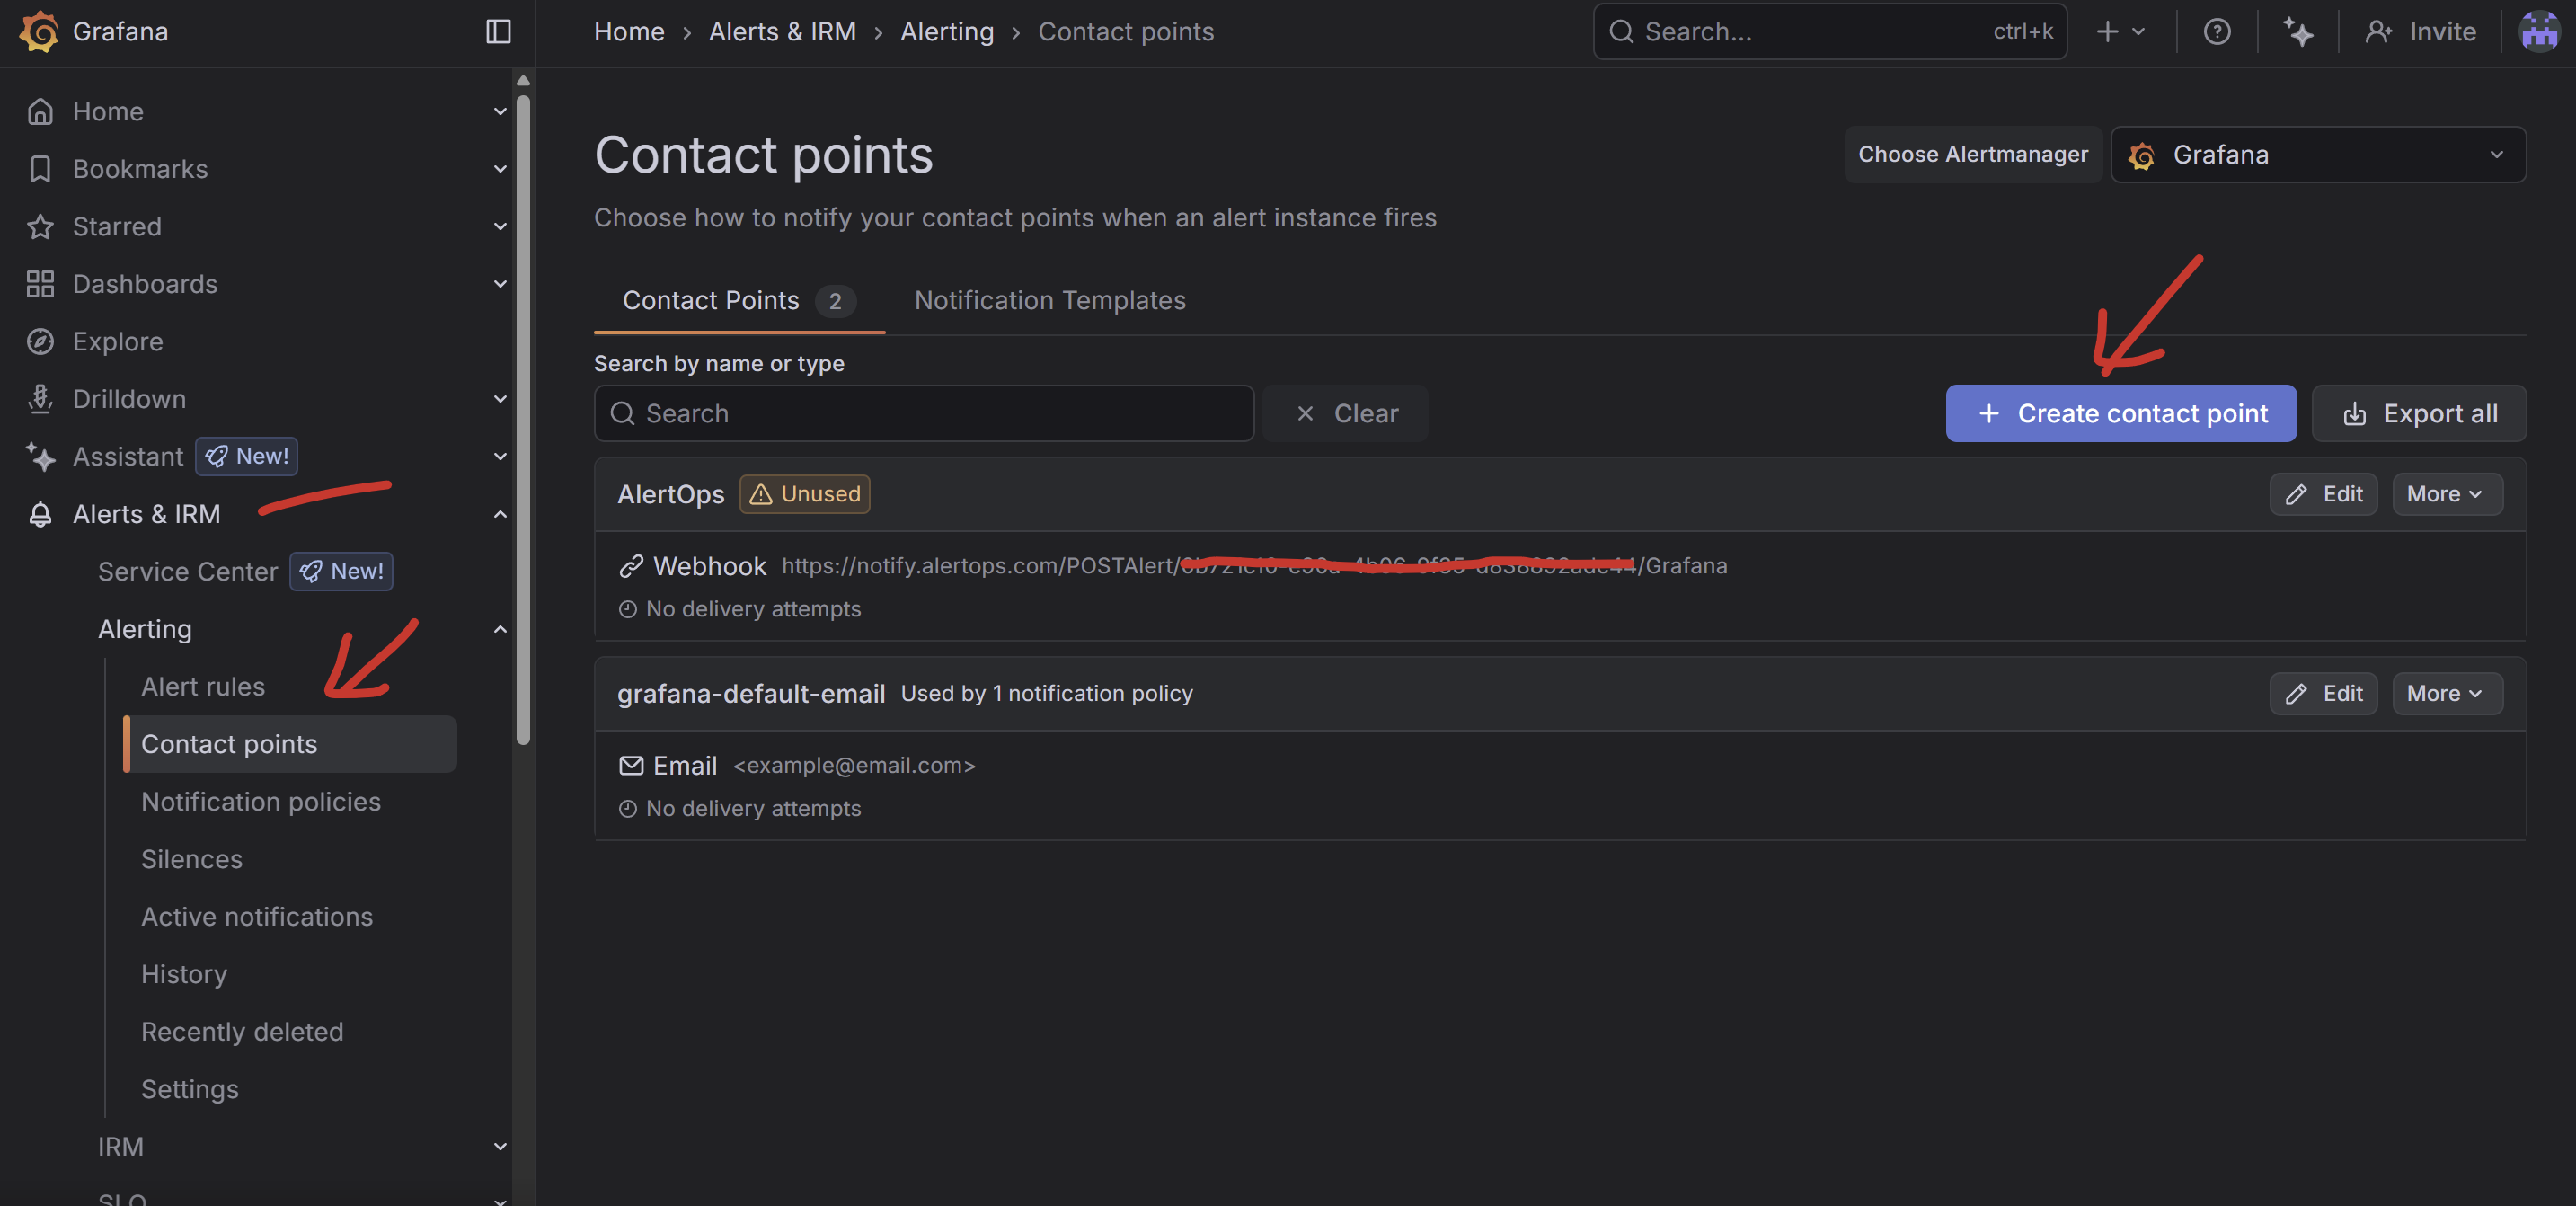
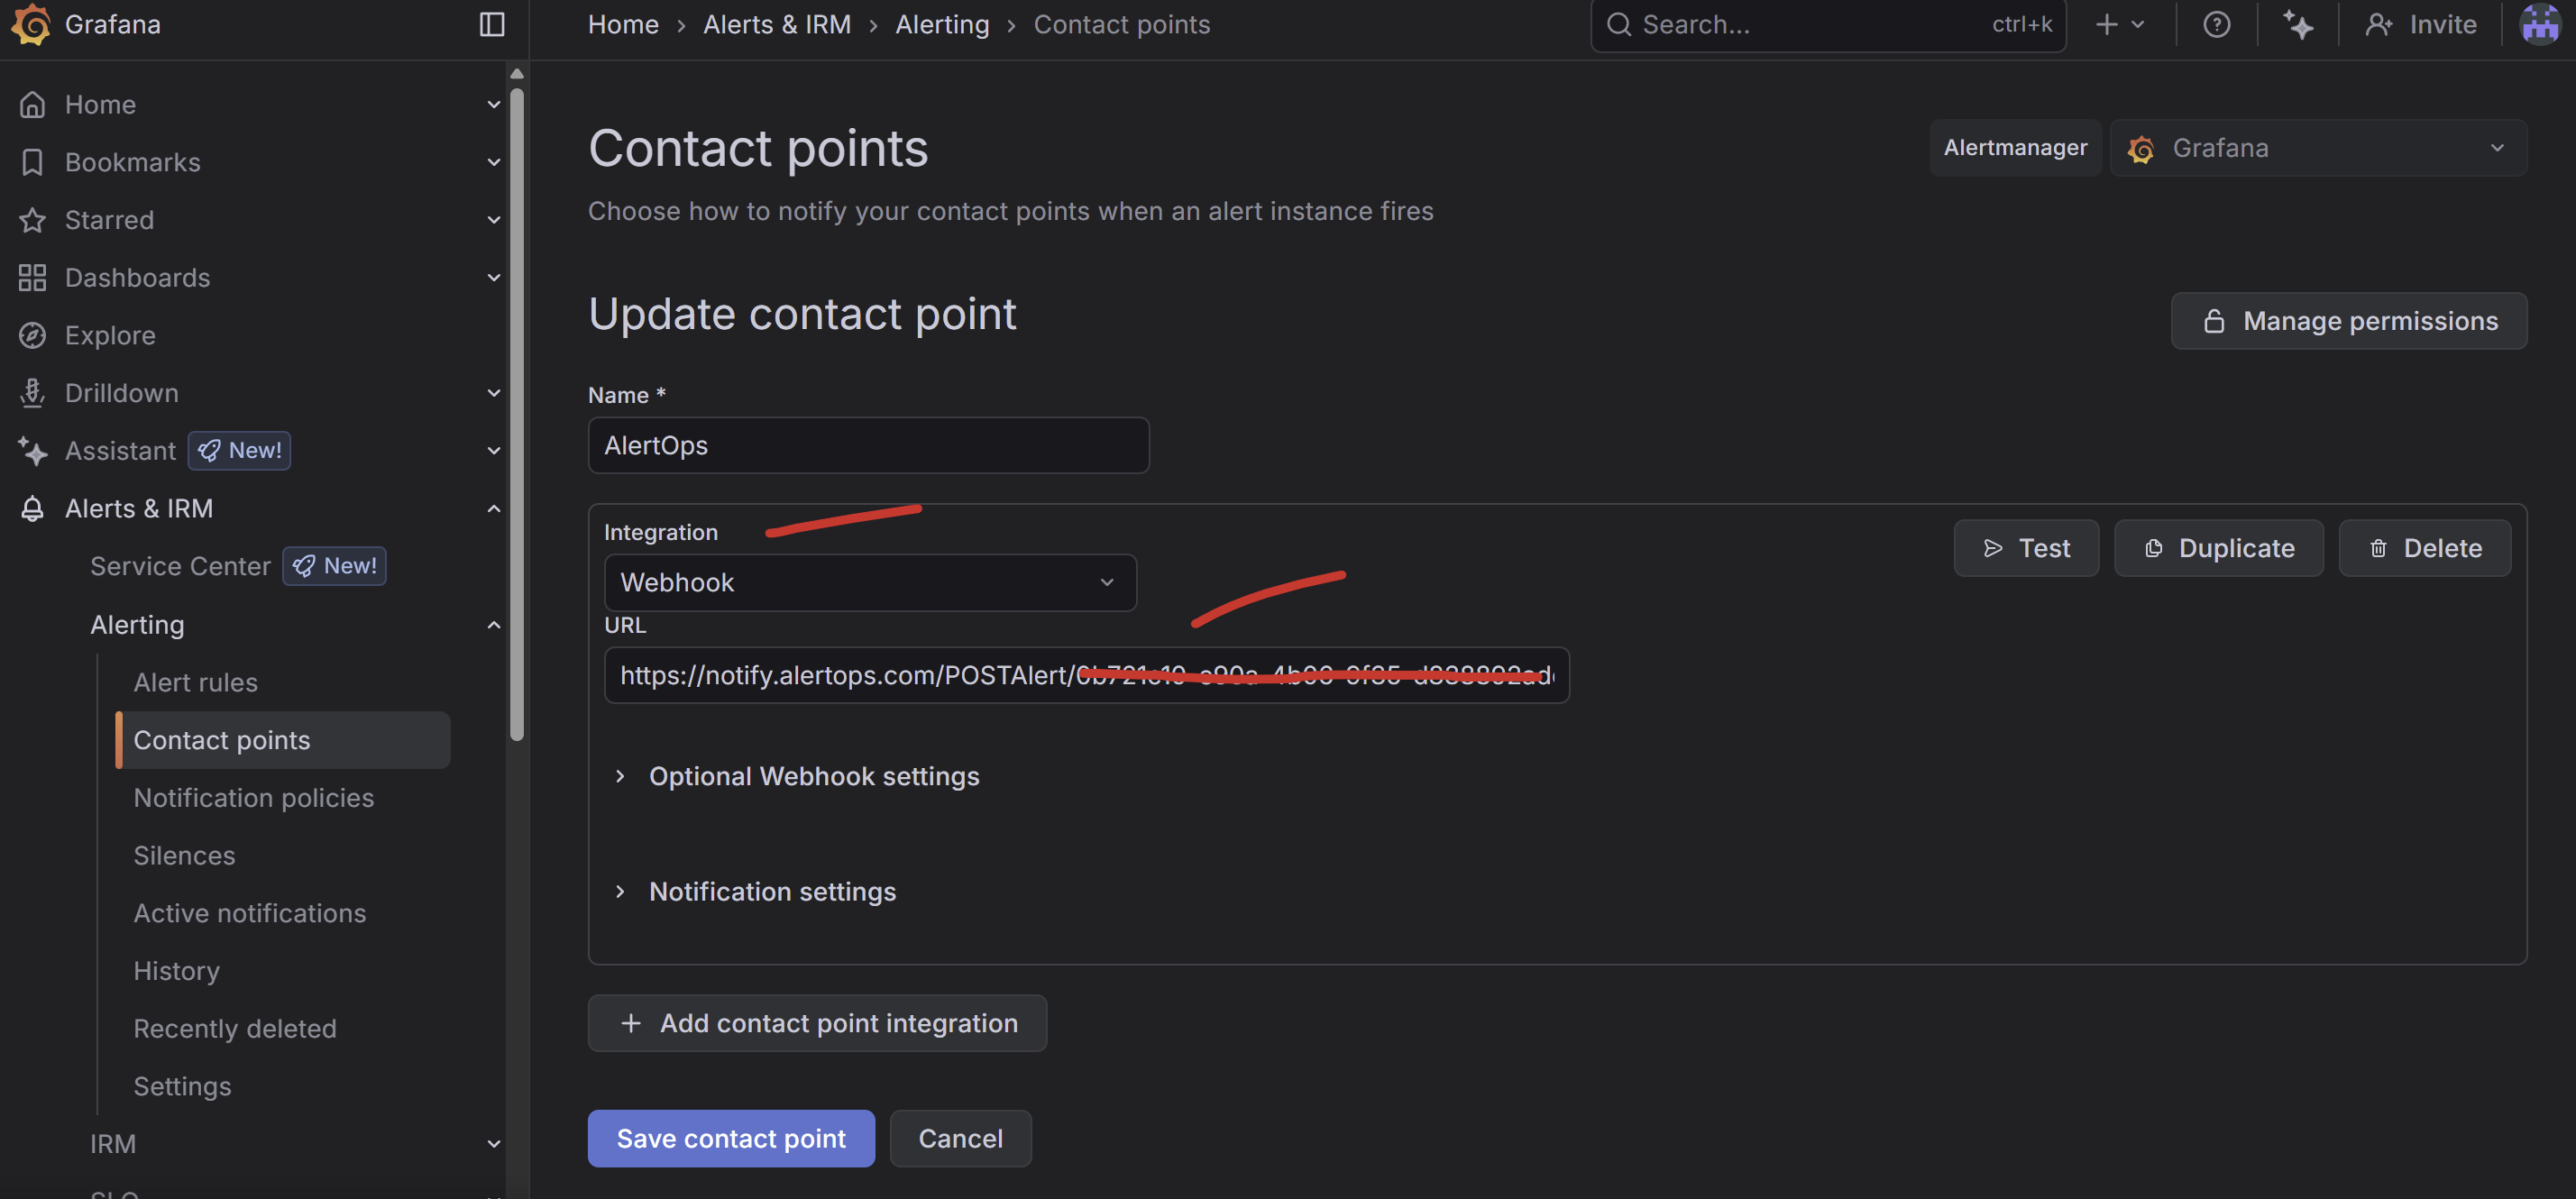
Step 2: Select Integration Type as 'Webhook' under URL, paste the AlertOps Inbound Integration URL, under Optional Webhook Settings, ensure HTTP Method is selected as POST. You can leave the rest default and Save.
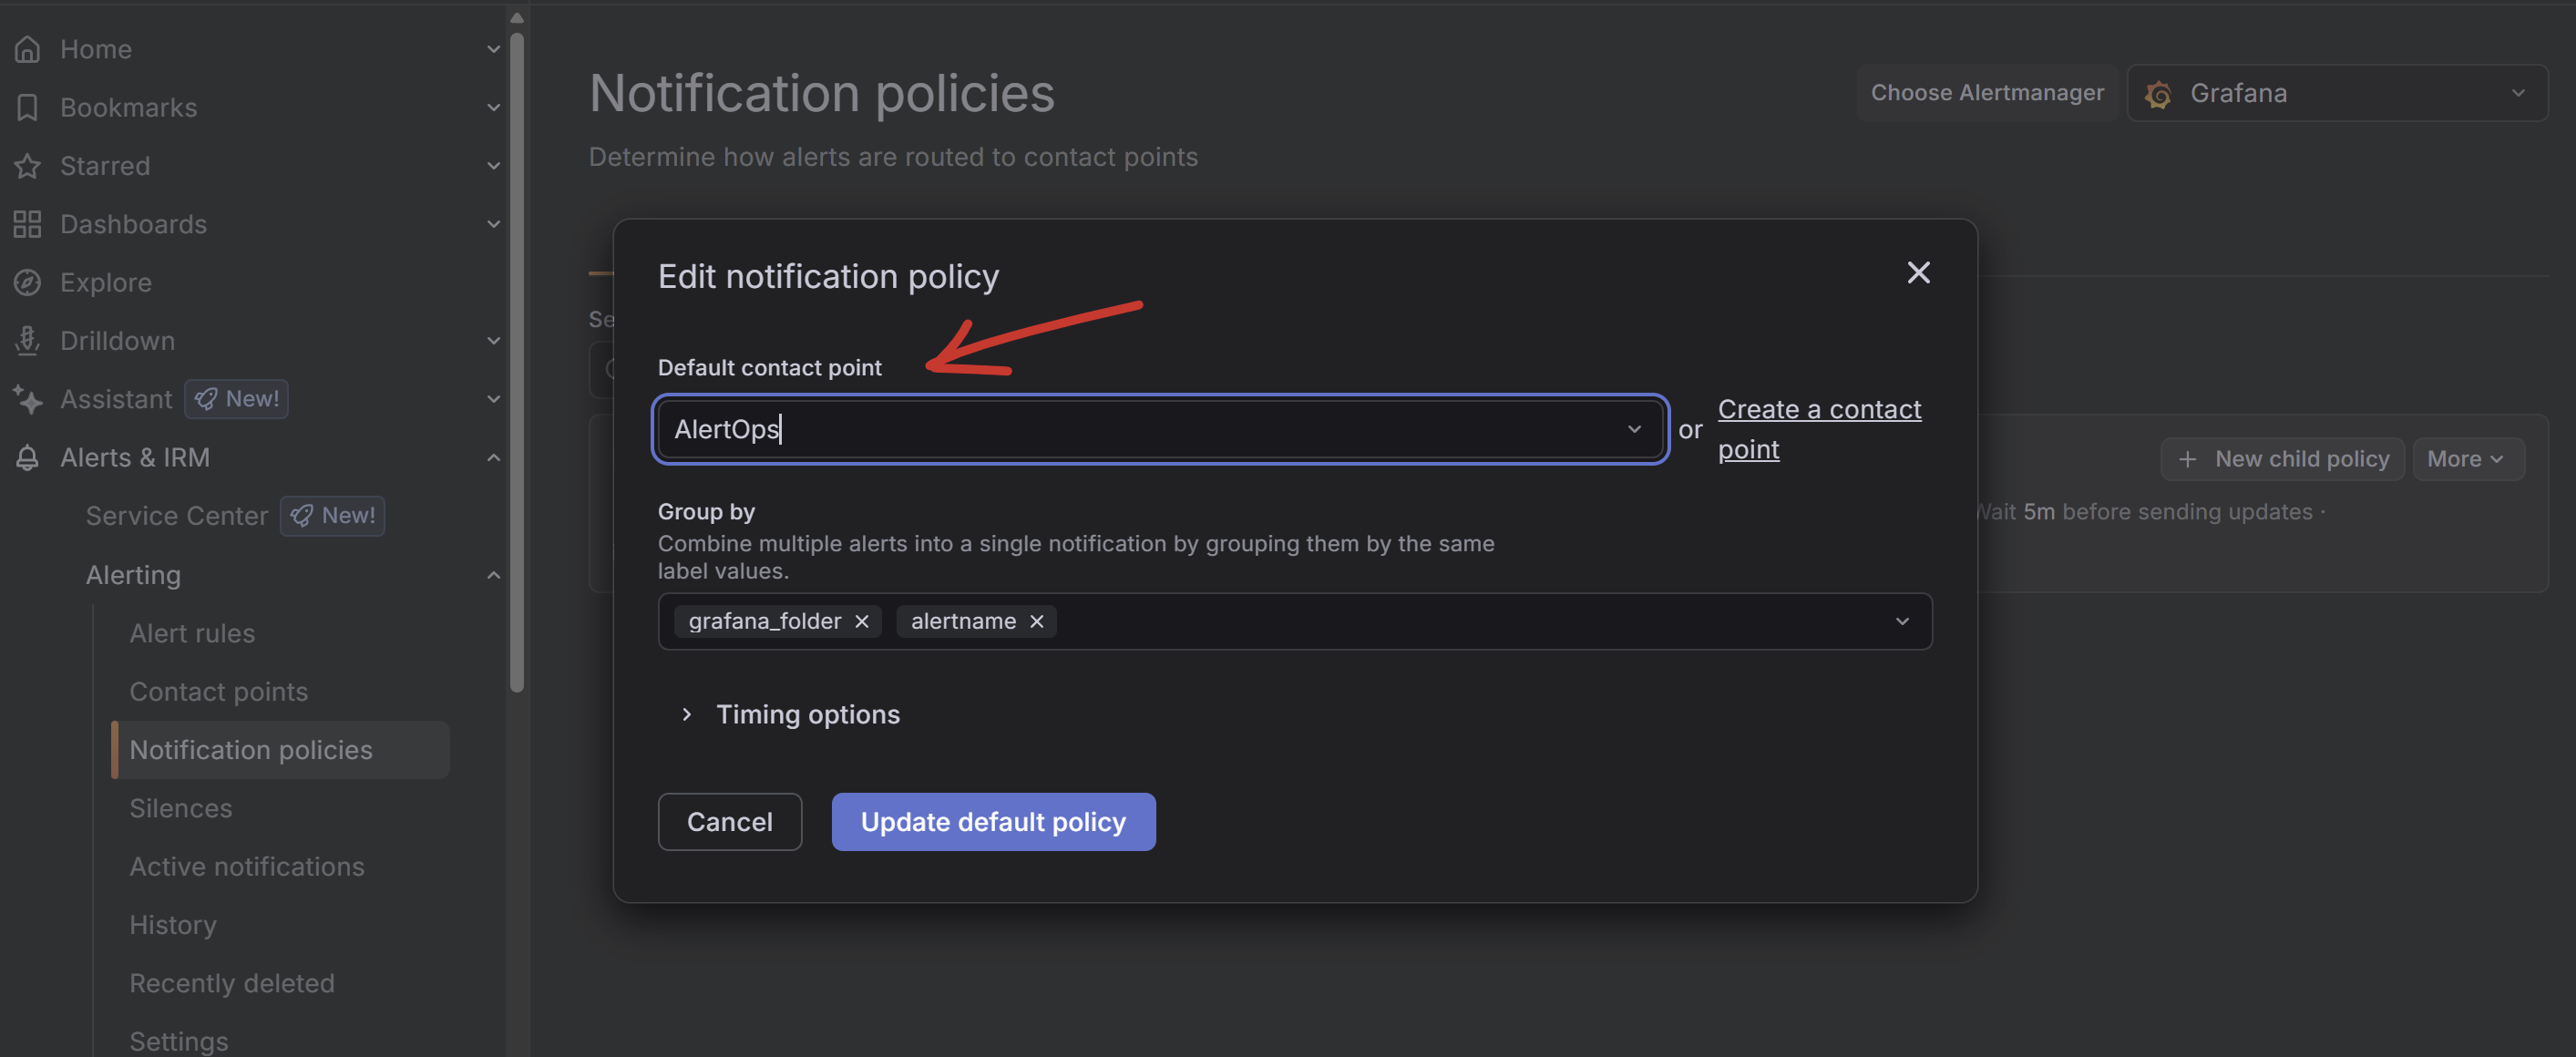
Step 3: Now for any Notification Policy that you may have, ensure you associate the contact point
***For more information on configuring when Grafana should generate an alert, please refer to the Grafana Alert Rules documentation
Alert Triggering Information
AlertOps will automatically create an incident when a new alert is received from Grafana with a status of “Firing, [Alerting], alerting .”
If an alert with status “Firing, [Alerting], alerting ” matches an existing Open Alert, AlertOps will recognize the new alert as a duplicate and ignore the alert. The alert will be recorded in the Inbound Messages table as “Mapped Appended.”
AlertOps will automatically close the same incident when an alert with a status “[OK], Normal, normal, ok ” is received.
AlertOps will automatically update the same incident when an alert with an IncidentStatus status “[Pending] or Pending” is received.
Testing and Troubleshooting
Click here to read about Web API Testing and Troubleshooting.
Was this article helpful?