Dynatrace
- 03 May 2024
- 6 Minutes to read
- Print
- DarkLight
- PDF
Dynatrace
- Updated on 03 May 2024
- 6 Minutes to read
- Print
- DarkLight
- PDF
Article summary
Did you find this summary helpful?
Thank you for your feedback!
Dynatrace Integration Guide
The Dynatrace APM solution provides user experience analysis that identifies and resolves application performance issues faster than ever before. Integrate AlertOps’ alert management platform with Dynatrace to receive and respond to critical email alerts. AlertOps ensures that alerts received from Dynatrace always reach the correct, available team member by utilizing escalation policies and on-call schedules.
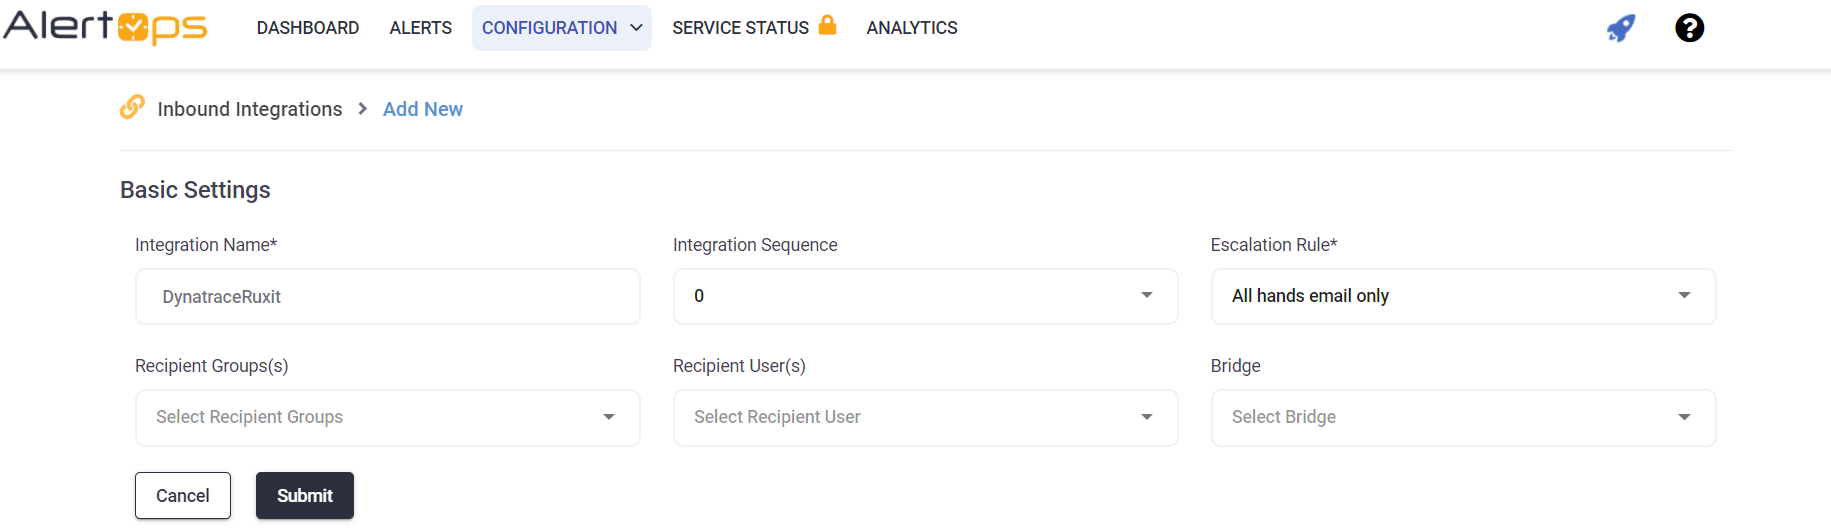
AlertOps Configuration
- Navigate to Configuration àIntegrations àAdd API Integration, the corresponding API Integration Detail page opens
- Select DynatraceRuxit from the pre-built Integration Templates.
- Enter a name for the integration. Select an escalation rule to determine the integration's escalation policy. And enter the names of recipient group(s) and recipient user(s).
- Click 'SAVE.' Then, click 'COPY URL' to copy the URL endpoint to be used in the DynatraceRuxit configuration.
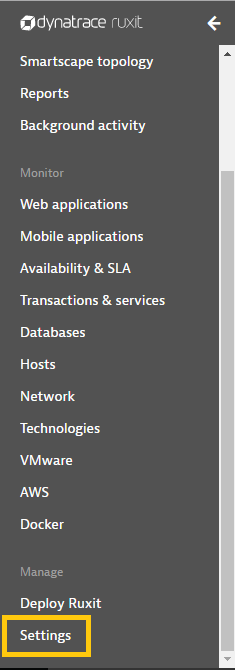
Dynatrace Ruxit Configuration
Step 1: From the main menu, hover over Integrations and then select Inbound Integrations from the sub menu.
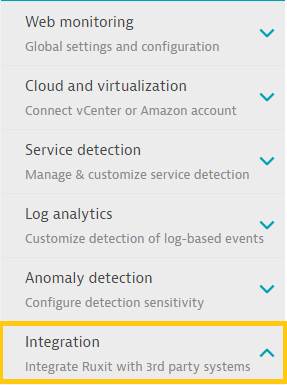
Step 2: Select the Integration tab.
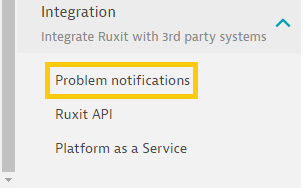
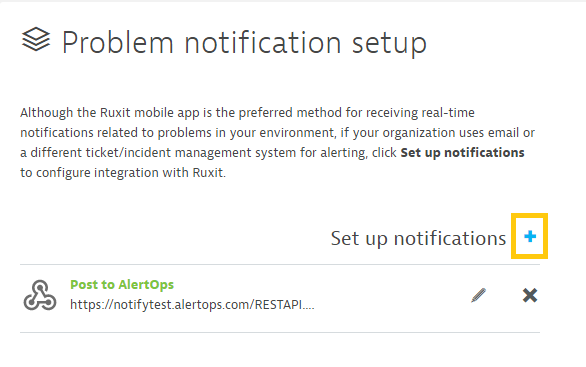
Step 3: Select Problem Notifications from the drop-down menu.
Step 4: Set up a new notification by clicking on the “+” button.
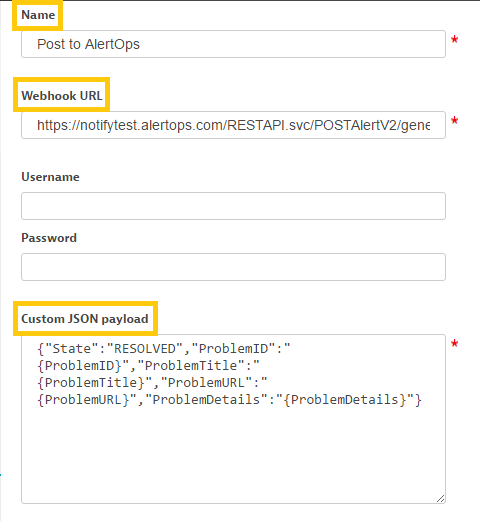
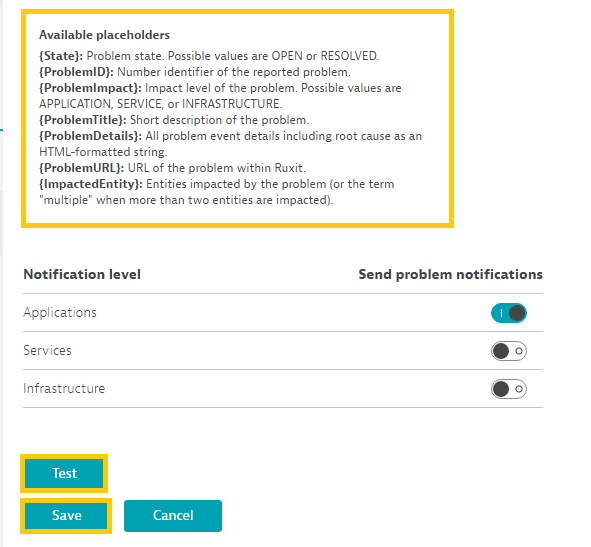
Step 5: Configure the notification, while making sure to include the necessary information. A custom JSON payload may be created using the placeholders found below.
Step 6: Test and save the notification.
Click here to view advanced integration options.
Alert Triggering Information
AlertOps will automatically create an incident when a new alert is received from Dynatrace with an IncidentStatus status of “OPEN.”
If an alert with status “OPEN” matches an existing Open Alert, AlertOps will recognize the new alert as a duplicate and ignore the alert. The alert will be recorded in the Inbound Messages table as “Mapped Appended.”
Testing and Troubleshooting
Click here to read about Web API Testing and Troubleshooting.
Elastic-Kibana Watcher Integration
Watcher is a feature of the Elastic Stack which enables users to send alerts or trigger actions based on certain events or threshold limits within their data. Integrate your Elastic Watches to send information via webhook when certain conditions or thresholds generate an alert.
- Have configured your elastic instance
***For help with this process please view elastic documentation:
https://www.elastic.co/guide/index.html
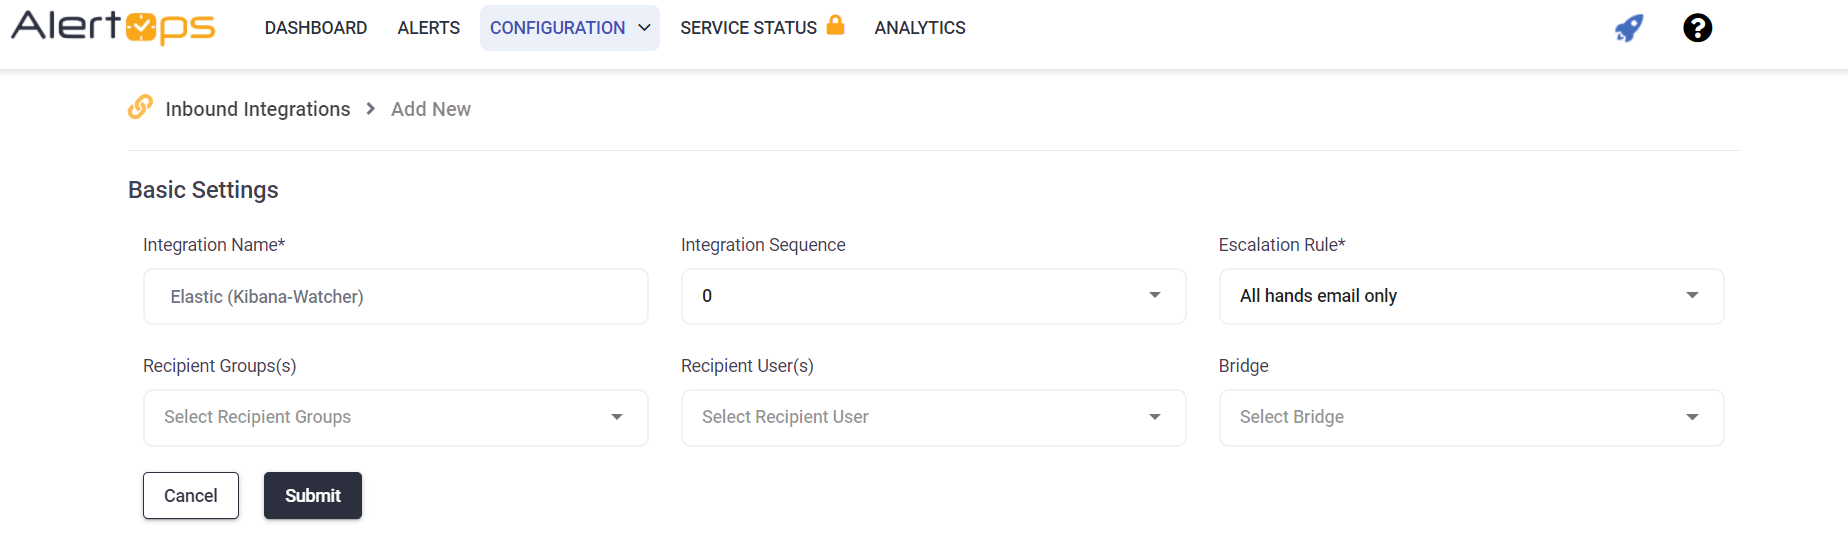
- Create Inbound AlertOps Integration
- Create an Integration Name
- Use the Elastic Escalation Rule
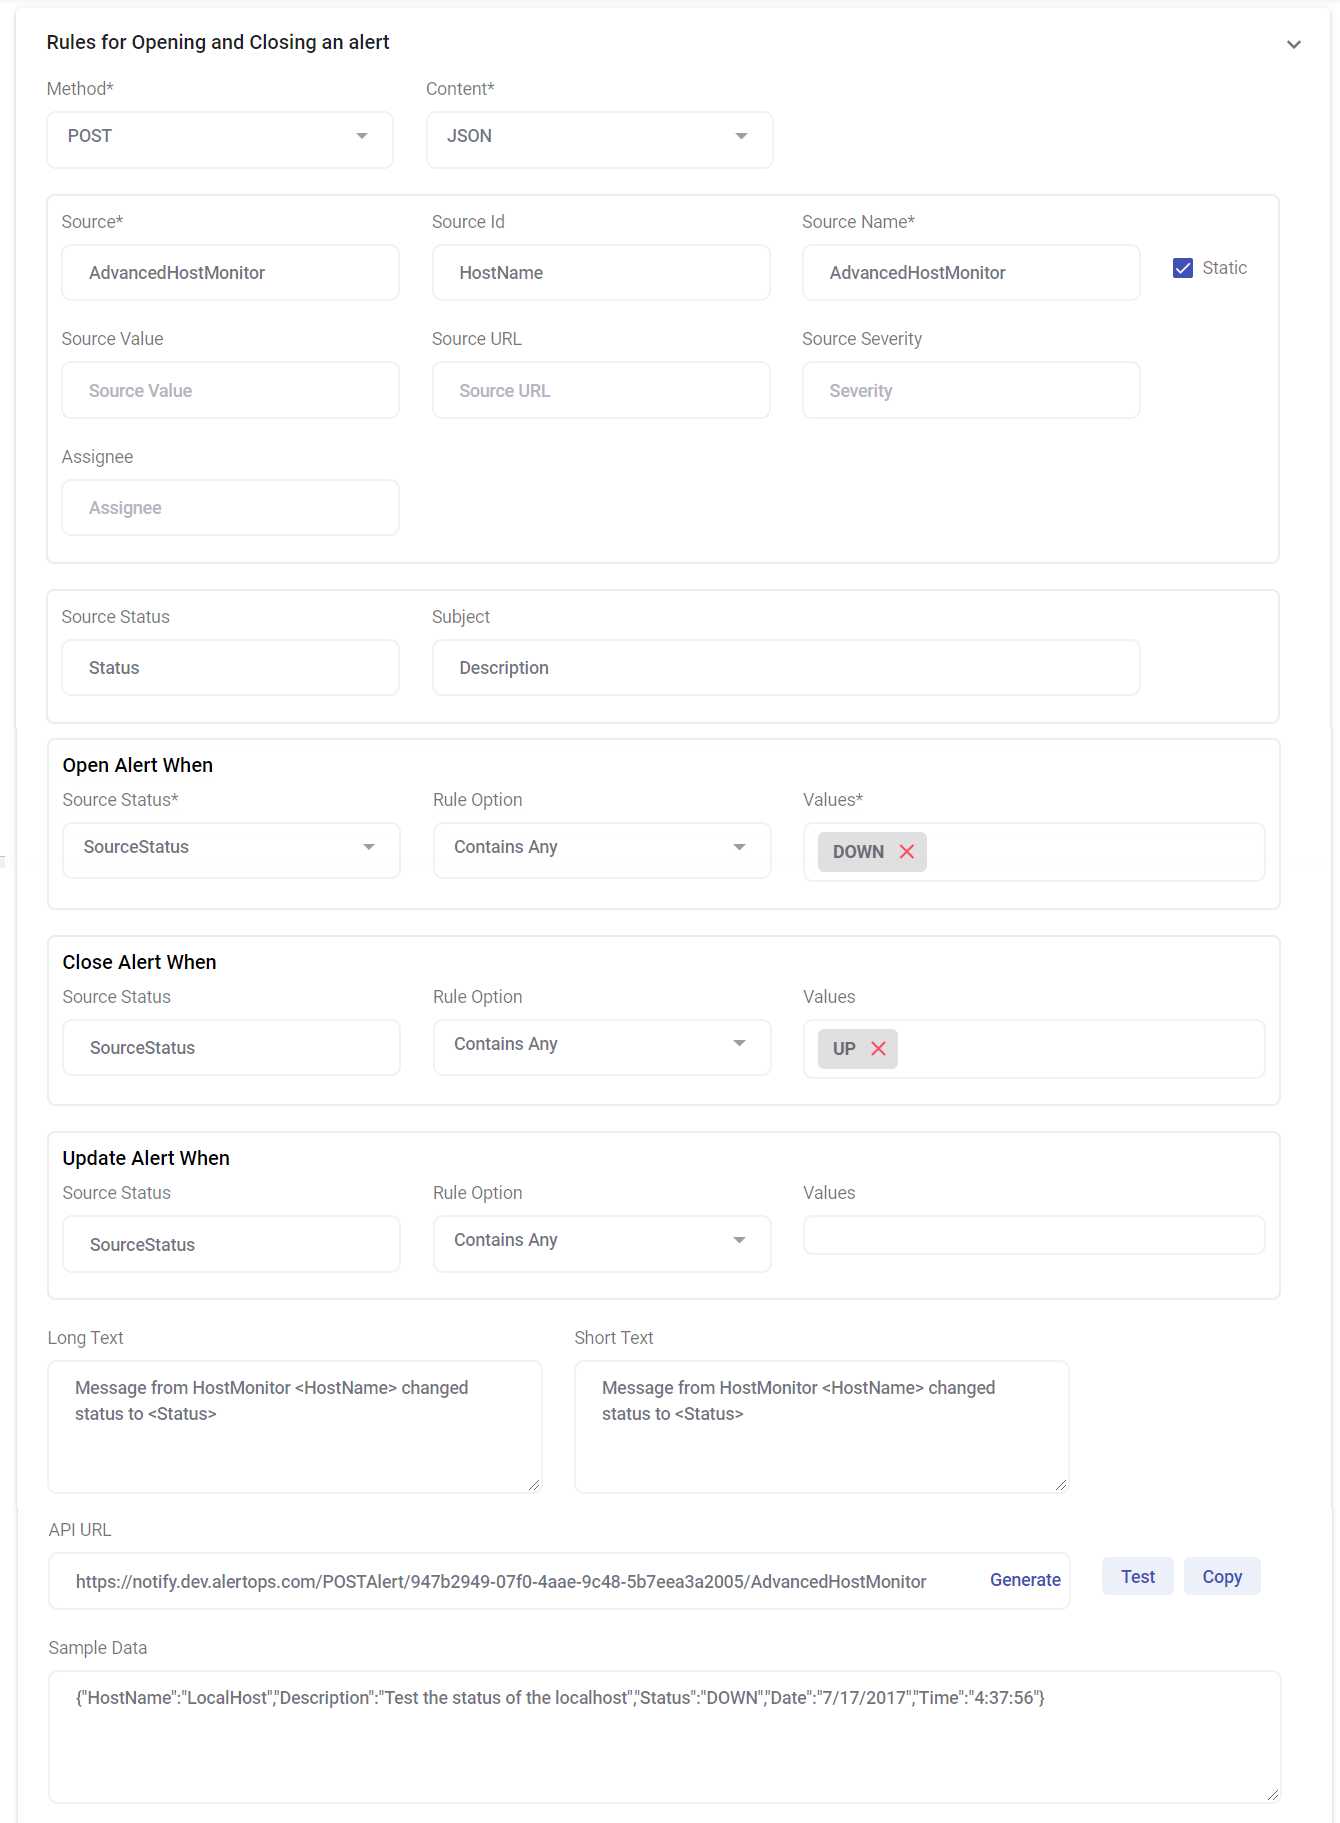
**You will configure this later so select a random rule - In URL Mapping select POST method and JSON for content
- Enter source as your see fit
- For Source Name enter metadata^name
- For Source ID enter watch_id
- For Source Status enter metadata
- Use Body for the Open alert When field
- Select contains any
- Enter watch_id
3. Configure Elastic Watch (Advanced JSON)
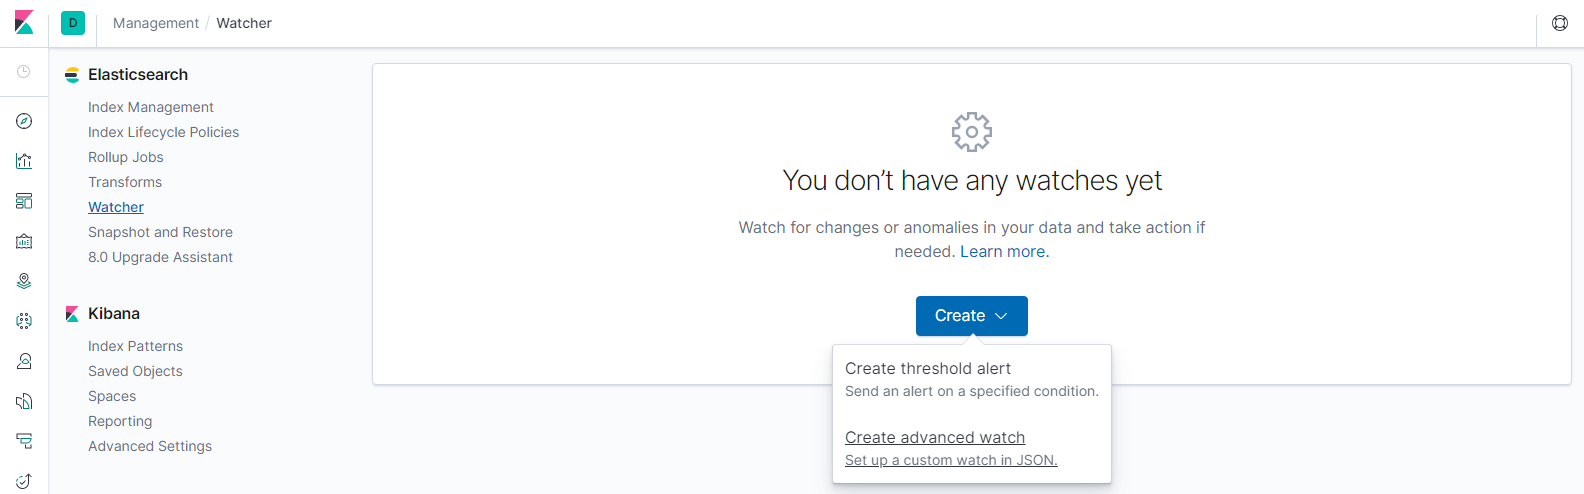
***Before continuing with this step, you must have your elastic watch and
conditions configured. For help with this process please review Elastic's watcher
documentation: https://www.elastic.co/guide/en/kibana/current/watcher-ui.html
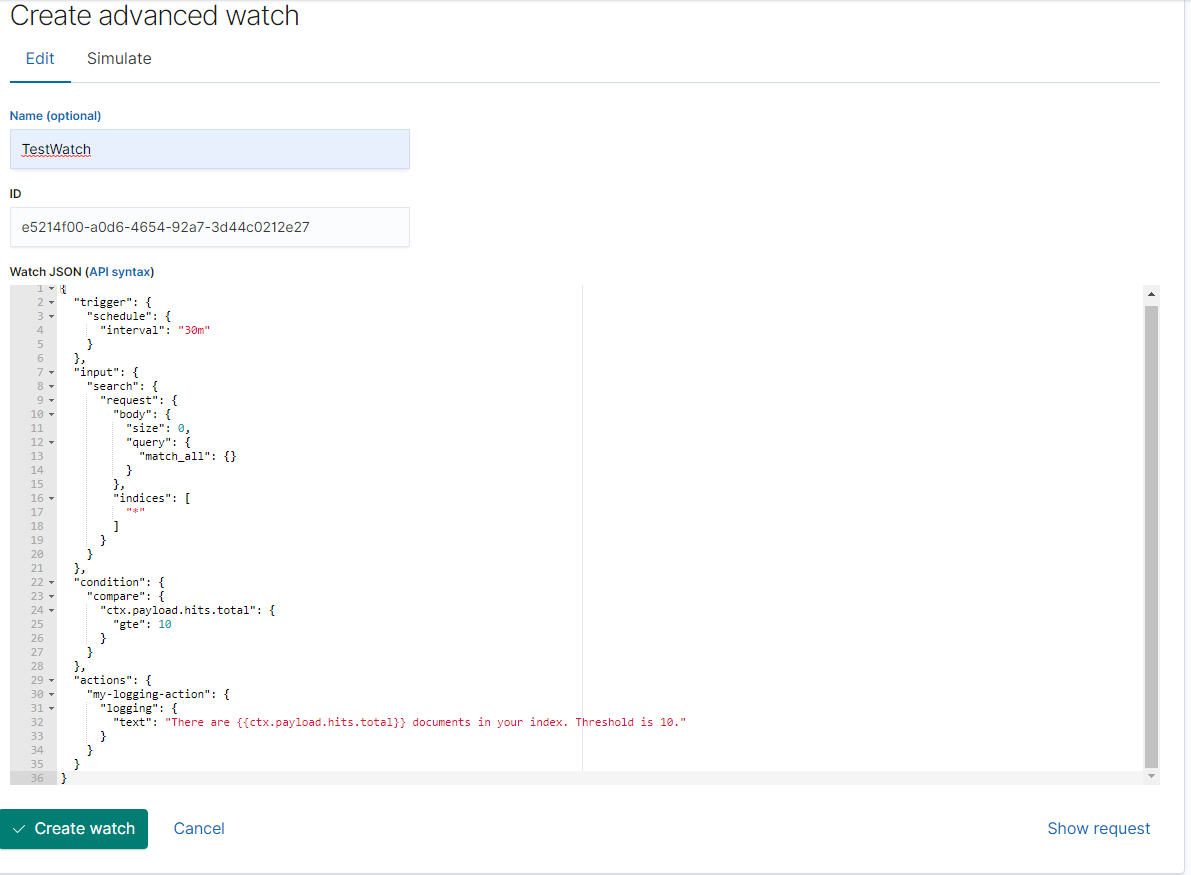
- Once configured according to your own specific checks, replace the actions field with the following based on the template provided below:
- Change the Name of your watch
- Change the path to your Elastic integration
- If wanted, change Throttle period
When a watch’s alerts are acknowledged via AlertOps, subsequent messages will stop being sent. To reduce alert noise, you can set a Throttle Period on a watch in minutes to stop sending messages to AlertOps following one that was sent for the specified period.
- Save Watch
**********************************************************************************************
"actions": {
"Name of your Watch": {
"throttle_period": "0m",
"webhook": {
"scheme": "https",
"host": "notify.alertops.com",
"port": 443,
"method": "post",
"path": "/Path to /your /Elastic integration",
"params": {},
"headers": {
"Content-Type": "application/json"
},
"body": "{{#toJson}}ctx{{/toJson}}"
}
}
},
**********************************************************************************************
4. Configure Outbound Integration and Outbound Action AlertOps
A) Select Outbound Integrations from the main menu.
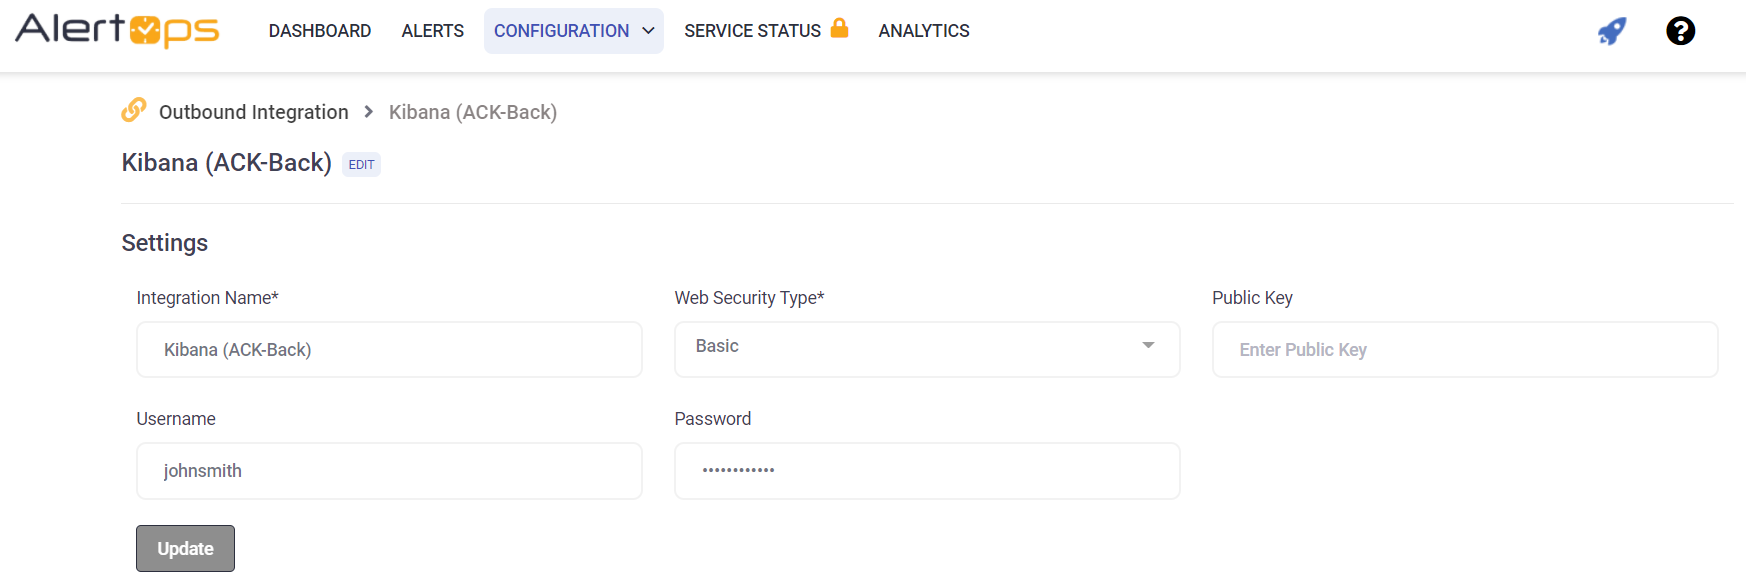
- Select ADD OUTBOUND INTEGRATION
- Create an Integration Name
- Select Basic as Web Security Type
- Generate an API Key in Kibana and place it in the Public Key field of your outbound integration
- Enter your UserName and Password in their respective fields in the Outbound Integration Detail and SAVE & CONTINUE
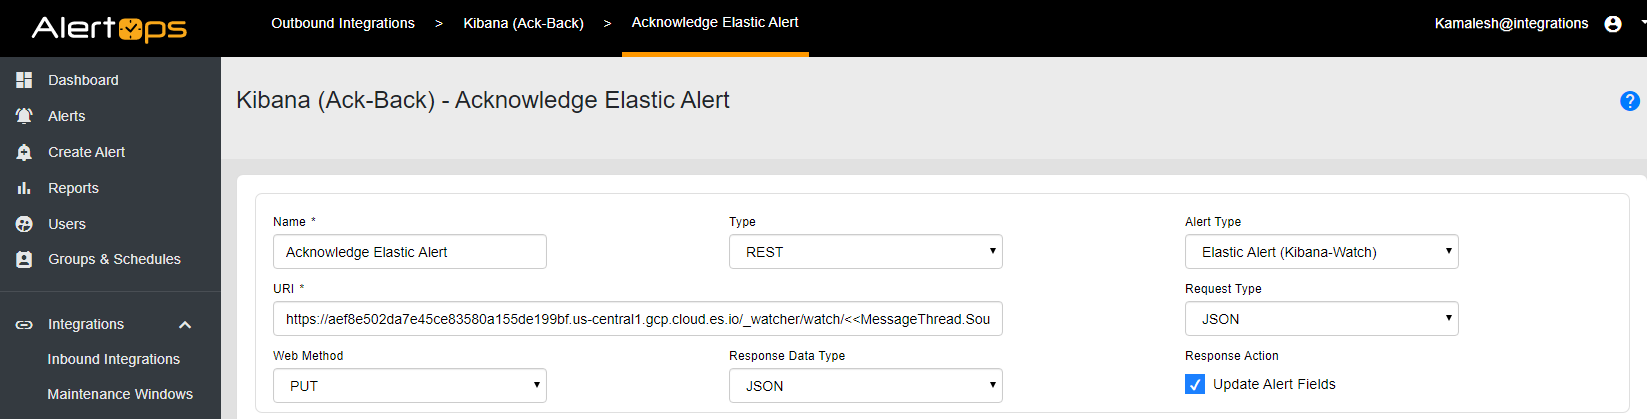
B) Configure Outbound Action Method for Outbound Integration
- In your Outbound Integrations Screen Select the Methods tab on the bottom portion of the view and select ADD METHOD
***This Outbound method is needed to acknowledge back to AlertOps. You must have a cloud instance of Elastic for alertops to send acknowledgement back to the source instance.
Input a name for the method used to acknowledge
Select REST for type
Select Standard Alert for Alert Type
For URI, use the following format
***https://hostname/_watcher/watch/<>/_ack
***Only change the hostname in the above URI
For Request Type select JSON
Select PUT for Web Method
Select JSON for Response Data Type
Select Update Alert Fields for Response Action.
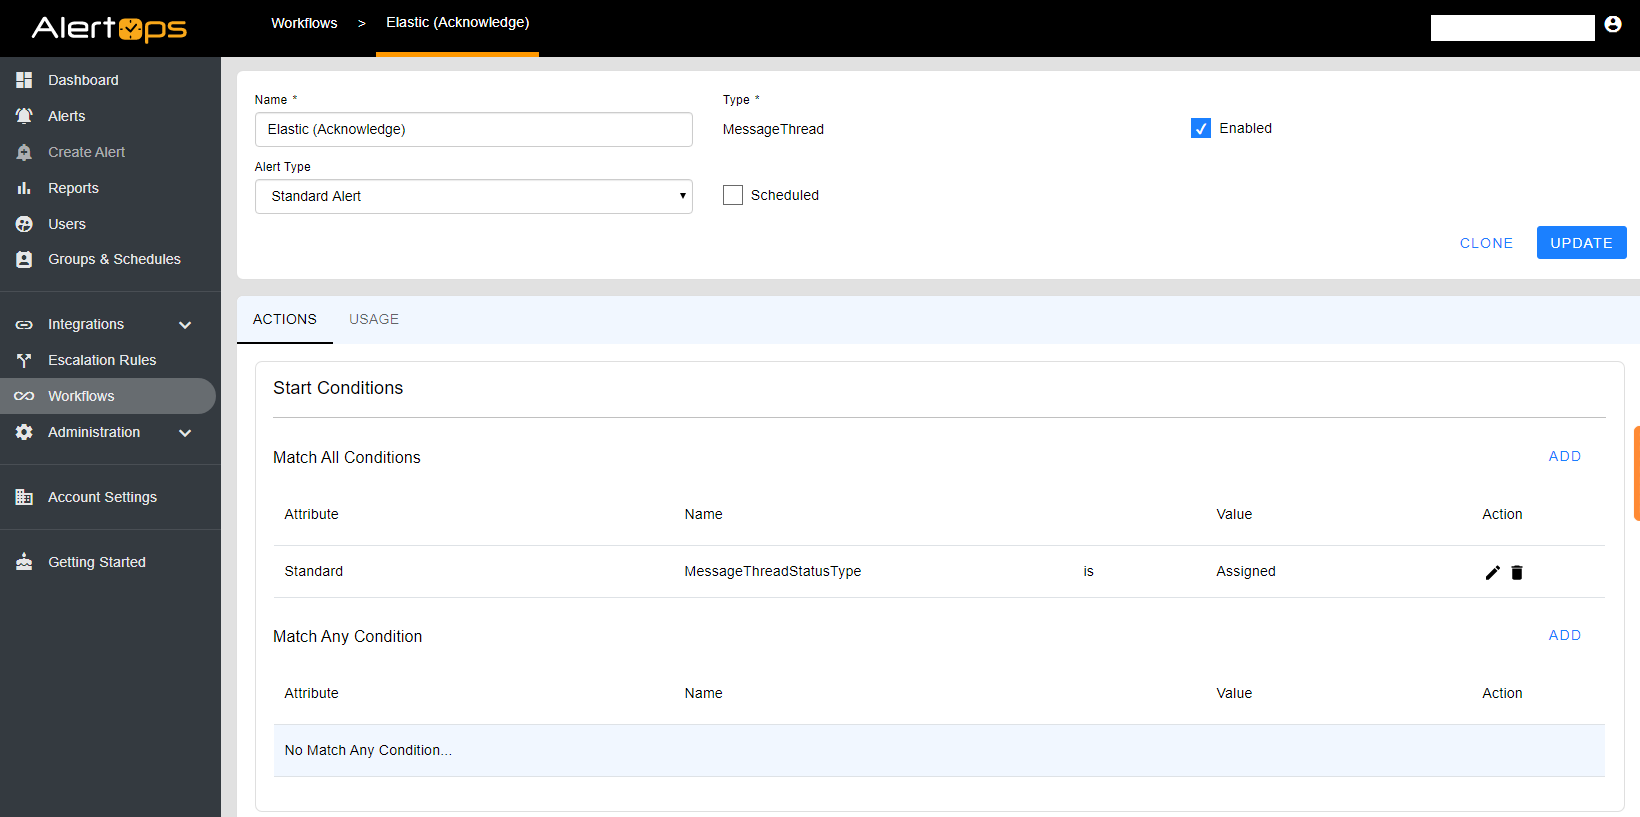
5. Configure Workflow with Outbound Action in AlertOps
- Under the Main Menu select Workflows and select ADD WORKFLOW
- Enter a name for your Workflow
- For Type Select MessageThread
- For Alert Type Select Standard Alert and click SAVE & CONTINUE
- On the bottom portion of the screen select the ACTIONS tab
- Under Start Conditions, under Match All Conditions select ADD
- Select Standard for the Attribute
- Select MessageThreadStatusType for the Name
- Select is for the relationship
- And Select Assigned for the Value
- Underneath Start Conditions, navigate to Actions the Section and Select ADD
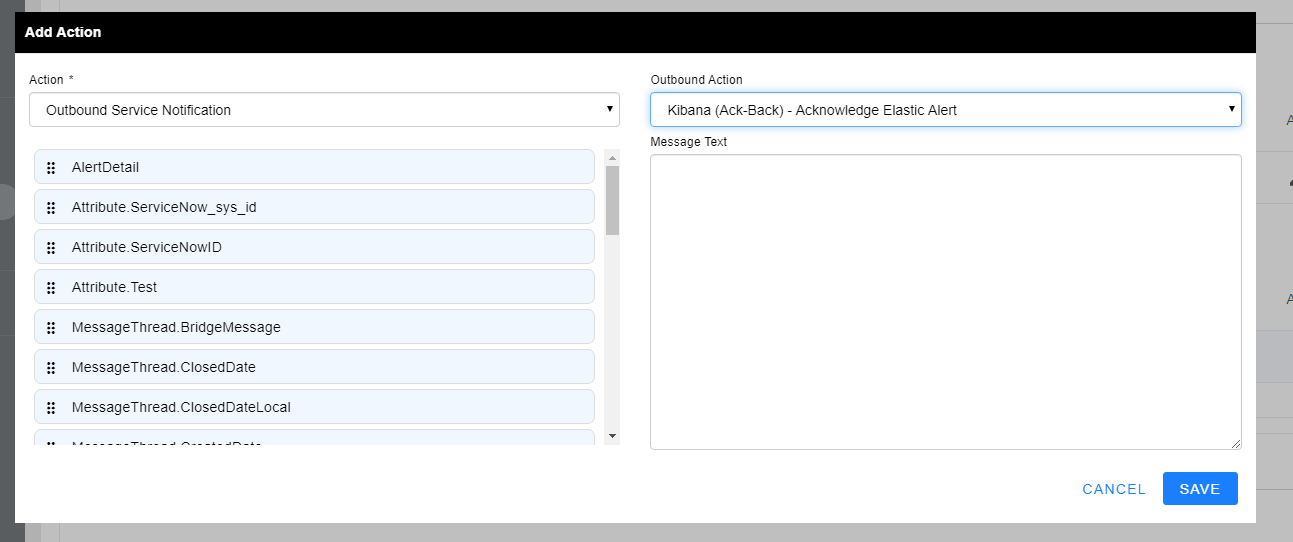
Select Outbound Service Notification
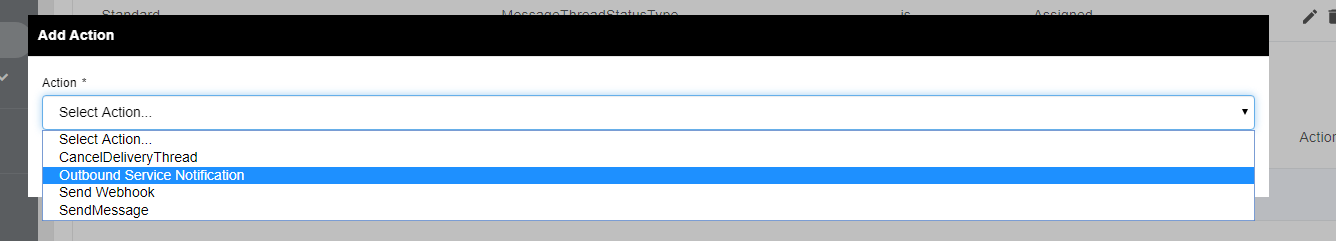
- In the Outbound Action dropdown, select the Outbound Action you just created within your Outbound Integration and select SAVE.
At the top of the Workflow page, select the Enabled checkbox and click UPDATE
- Configure Escalation Rule and add Workflow in AlertOps
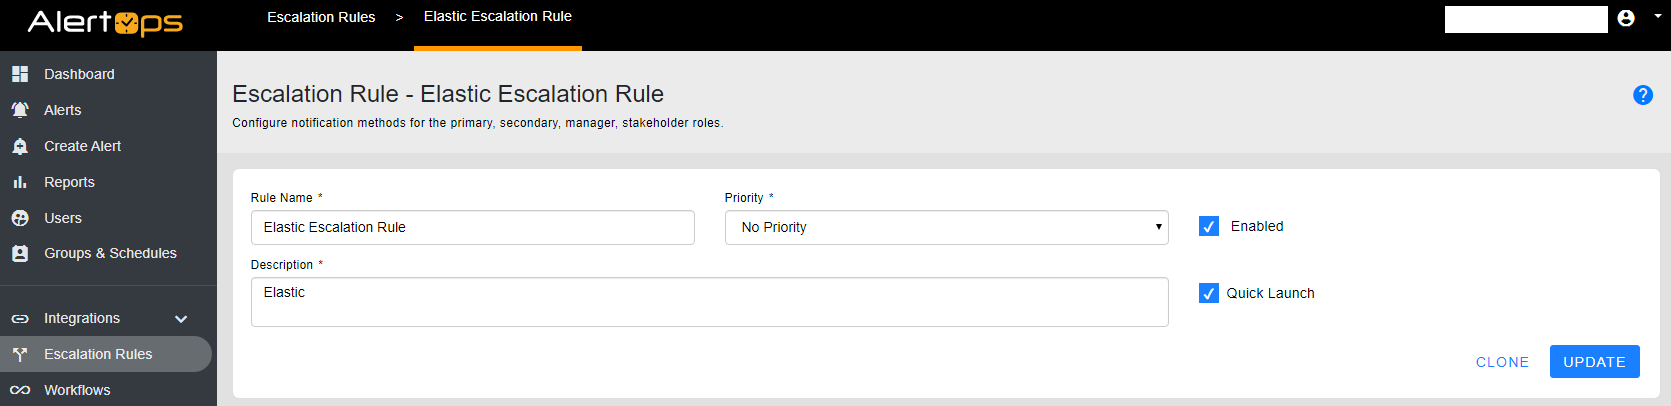
A) In the main menu select Escalation Rules and click ADD ESCALATION RULE
1) Enter your Rule Name
2) Select the priority you would like for your specific integration
3) You can enter your own integration description:
i.e. Standard Description: Escalation Rule for Elastic Kibana Watcher and Acknowledgement back to source system
4) Select Quick Launch and click SAVE & CONTINUE
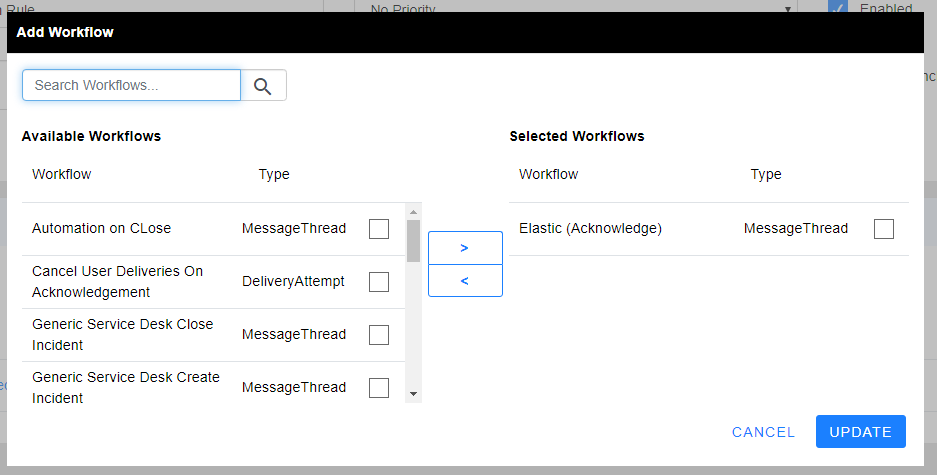
5) You should see the bottom portion of the screen now.
Under WORKFLOWS tab, select ADD WORKFLOW
a. Select the Workflow you just configured for Elastic
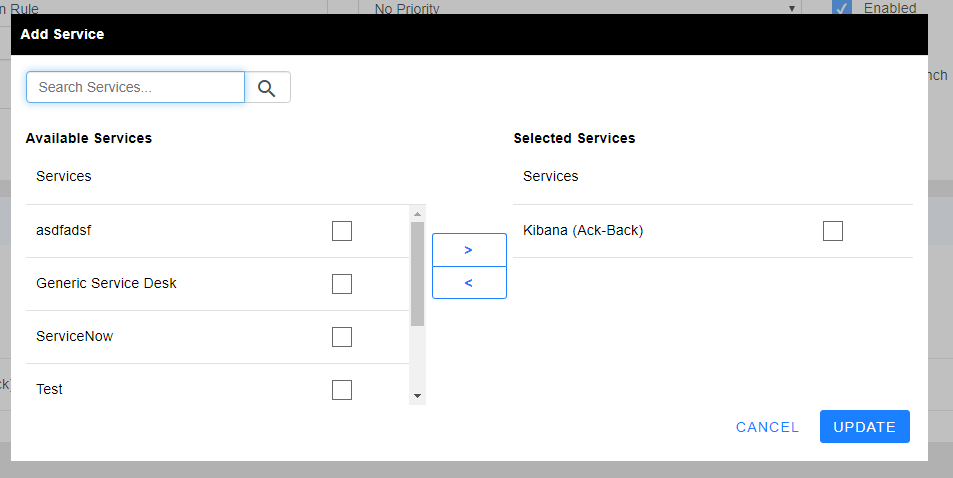
Under the OUTBOUND ACTIONS TAB
- Select the Outbound Action that you created and configured in your outbound integration and used in your workflow.
- Under Services, click ADD SERVICE and select your OutboundnElastic Integration.
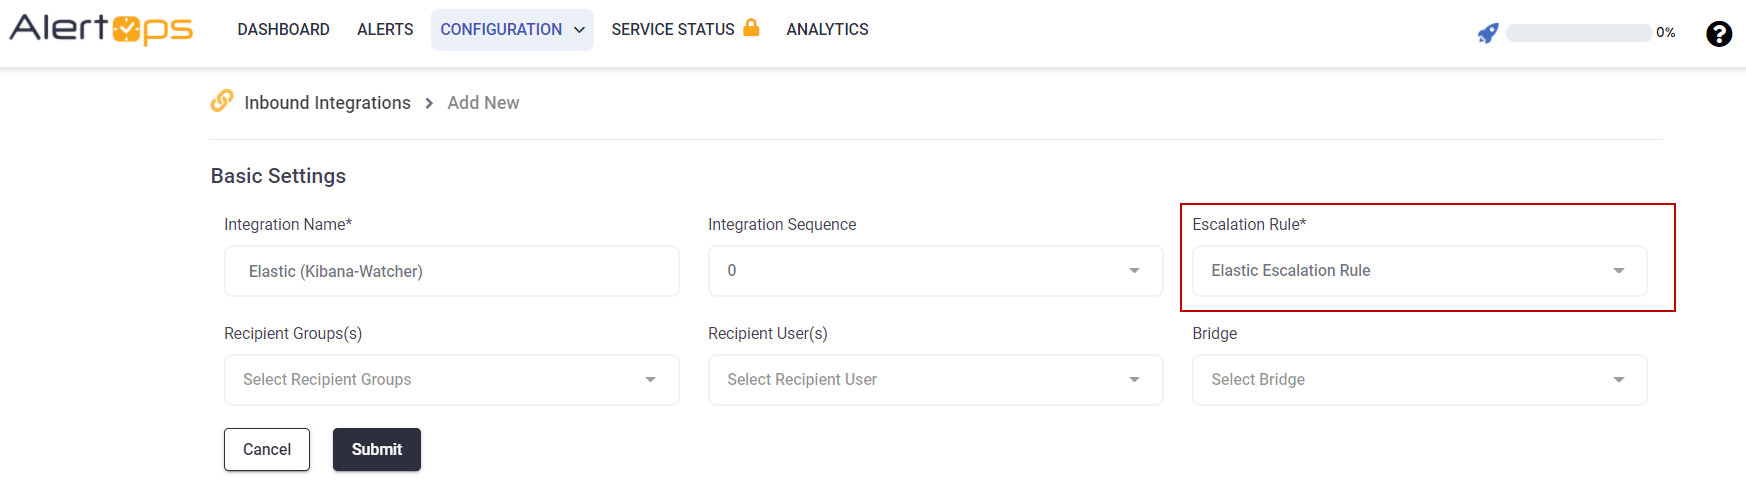
7. Return to your Inbound Integration that you initially configured
A) Select your inbound integration for Elastic and change the escalation rule to the one you just created and click UPDATE
Errorception
Errorception Integration Guide
Errorception is a simple and painless way to find out about JavaScript errors, as they occur in your users’ browsers. Integrate AlertOps’ alert management platform with Errorception to receive and respond to critical alerts through email, SMS, push notification, and phone alerts. AlertOps ensures that alerts received from Errorception always reach the correct, available team member by utilizing escalation policies and on-call schedules.
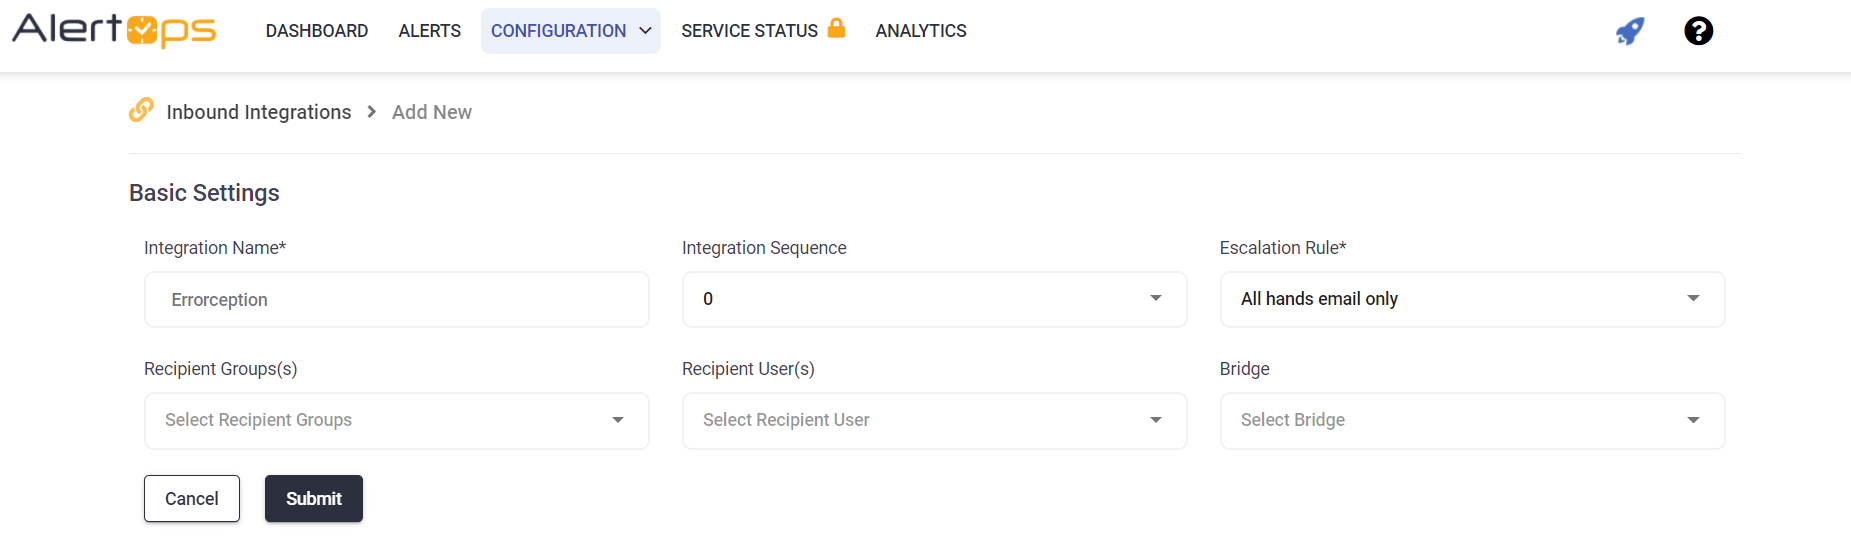
AlertOps Configuration
- Navigate to Configuration àIntegrations àAdd API Integration, the corresponding API Integration Detail page opens
- Select Errorception from the pre-built Integration Templates.
- Enter a name for the integration. Select an escalation rule to determine the integration's escalation policy.
- Enter the names of recipient group(s) and recipient user(s). Click 'SAVE.' Then, click 'COPY URL' to copy the URL endpoint to be used in the Errorception configuration.
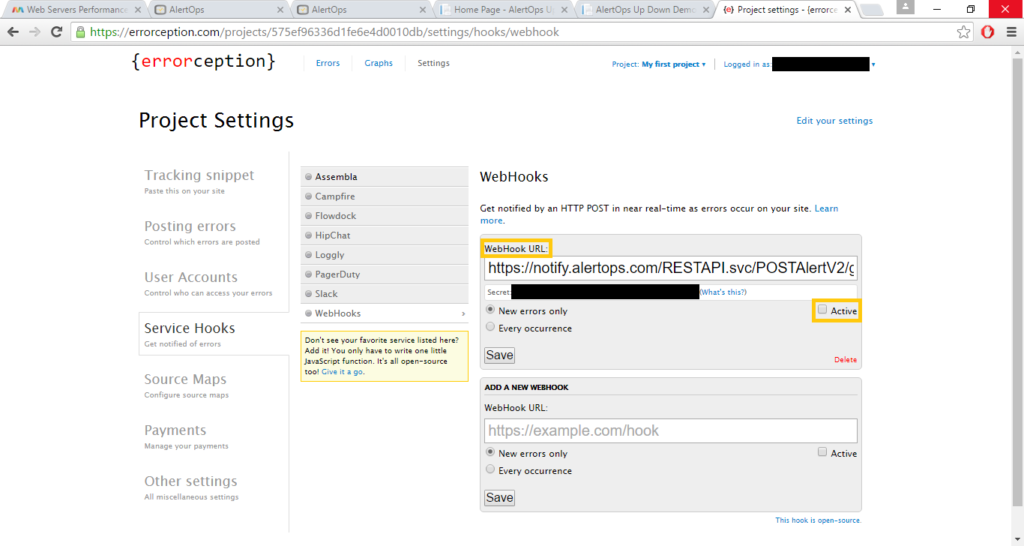
Errorception Configuration
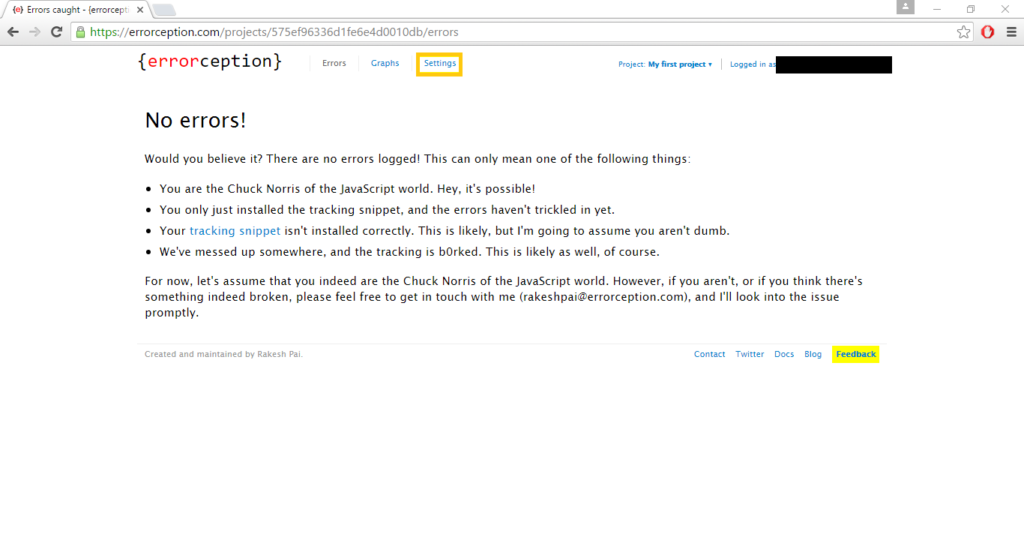
Step 1: Through, the custom Webhook integration in Errorception, go to Settings.
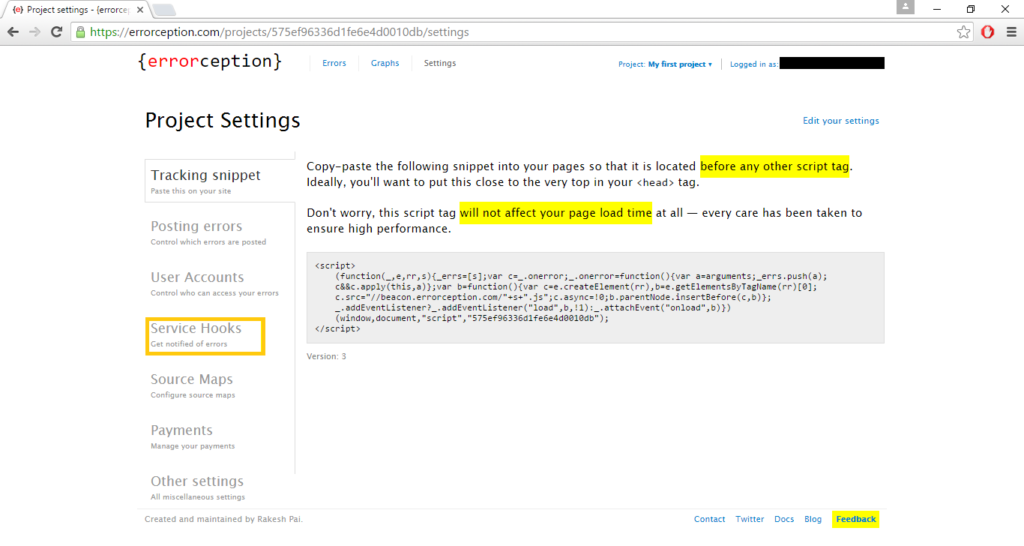
Step 2: Select Service Hooks
Step 3: Select WebHooks
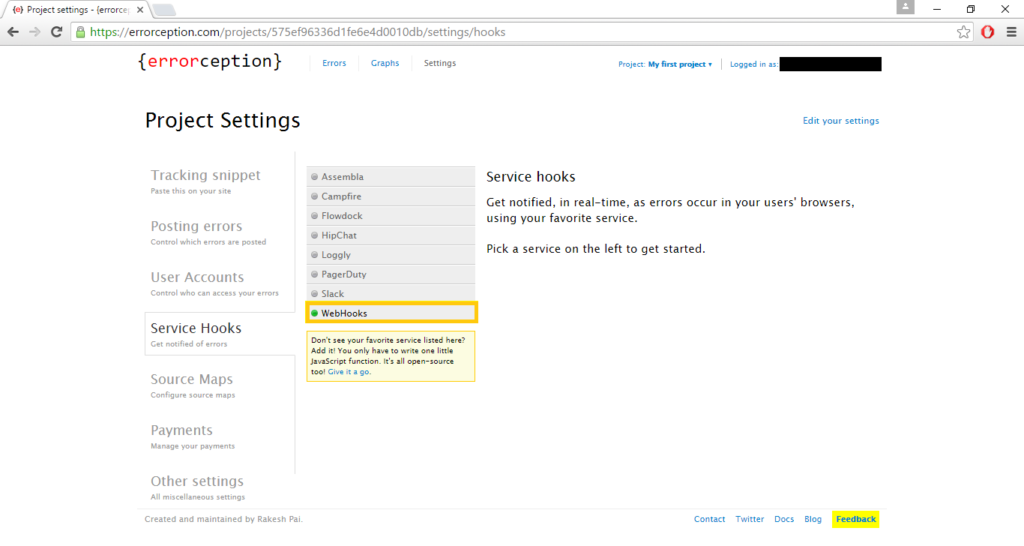
Step 4: Add a new WebHook and input the necessary information.
{
“isInline”:true,
“message”:”Uncaught ReferenceError: CreateError is not defined”,
“userAgent”:”Mozilla/5.0 (Windows NT 6.1; WOW64) AppleWebKit/537.36 (KHTML, like Gecko) Chrome/39.0.2171.95 Safari/537.36″,
“when”:”after”,
“scriptPath”:null,
“page”:”file:///C:/Users/xinlinr.BDCK/Desktop/Errorception.html”,
“date”:”2015-01-05T20:37:30.631Z”,
“isFirstOccurrence”:false,
“webUrl”:”http://errorception.com/projects/54aaf036c6b8309b5c000299/errors/54aaf57a1ead63ba4e587842″,
“apiUrl”:”https://api.errorception.com/projects/54aaf036c6b8309b5c000299/errors/54aaf57a1ead63ba4e587842″
}
Click here to view advanced integration options.
Alert Triggering Information
AlertOps will automatically create an incident when a new alert is received from Errorception with an IncidentStatus status of “isInline.”
Testing and Troubleshooting
Click here to read about Web API Testing and Troubleshooting.
Was this article helpful?