Analytics
- 11 Feb 2025
- 6 Minutes to read
- Print
- DarkLight
- PDF
Analytics
- Updated on 11 Feb 2025
- 6 Minutes to read
- Print
- DarkLight
- PDF
Article summary
Did you find this summary helpful?
Thank you for your feedback!
AlertOps Analytics & Reporting
AlertOps provides a comprehensive suite of reports and analytics tools to help teams monitor, manage, and optimize their incident response workflows. These reports offer valuable insights into alert volume, response efficiency, SLA adherence, and team performance, enabling data-driven decision-making.
Overview of Reports
The following reports help teams track and analyze different aspects of their alert management processes:
- Alert Assignment: Tracks how alerts are assigned to different owners over a specified date range to monitor alert distribution and response efficiency.
- Time to Acknowledge (TTA): Measures how quickly alerts are acknowledged, providing insight into response times.
- Time to Resolve (TTR): Tracks how quickly alerts are resolved, helping teams analyze their resolution efficiency.
- On Call Report: Provides a real-time view of the on-call schedule for a selected day or week
- Alert Summary: Displays a high-level overview of key alert metrics, including SLA adherence, assignment distribution, alert status, and alert topics.
- Open Alerts: Focuses on all open alerts from the past 30 days, categorizing them by Priority, SLA violations, and Status.
- Alert Trend: Provides insights into alert volume, resolution time, and SLA performance over different timeframes, including weekly, monthly, quarterly, or annual increments.
Using AlertOps Reports
All reports in AlertOps allow for export in CSV or PDF formats for further analysis. The ability to filter by different criteria ensures that teams can focus on the most relevant data for their operational needs. By leveraging these reports, organizations can enhance response times, improve SLA adherence, and optimize their on-call and resolution workflows.
For a detailed breakdown of each report, refer to the specific report sections below.
Alert Assignment Report
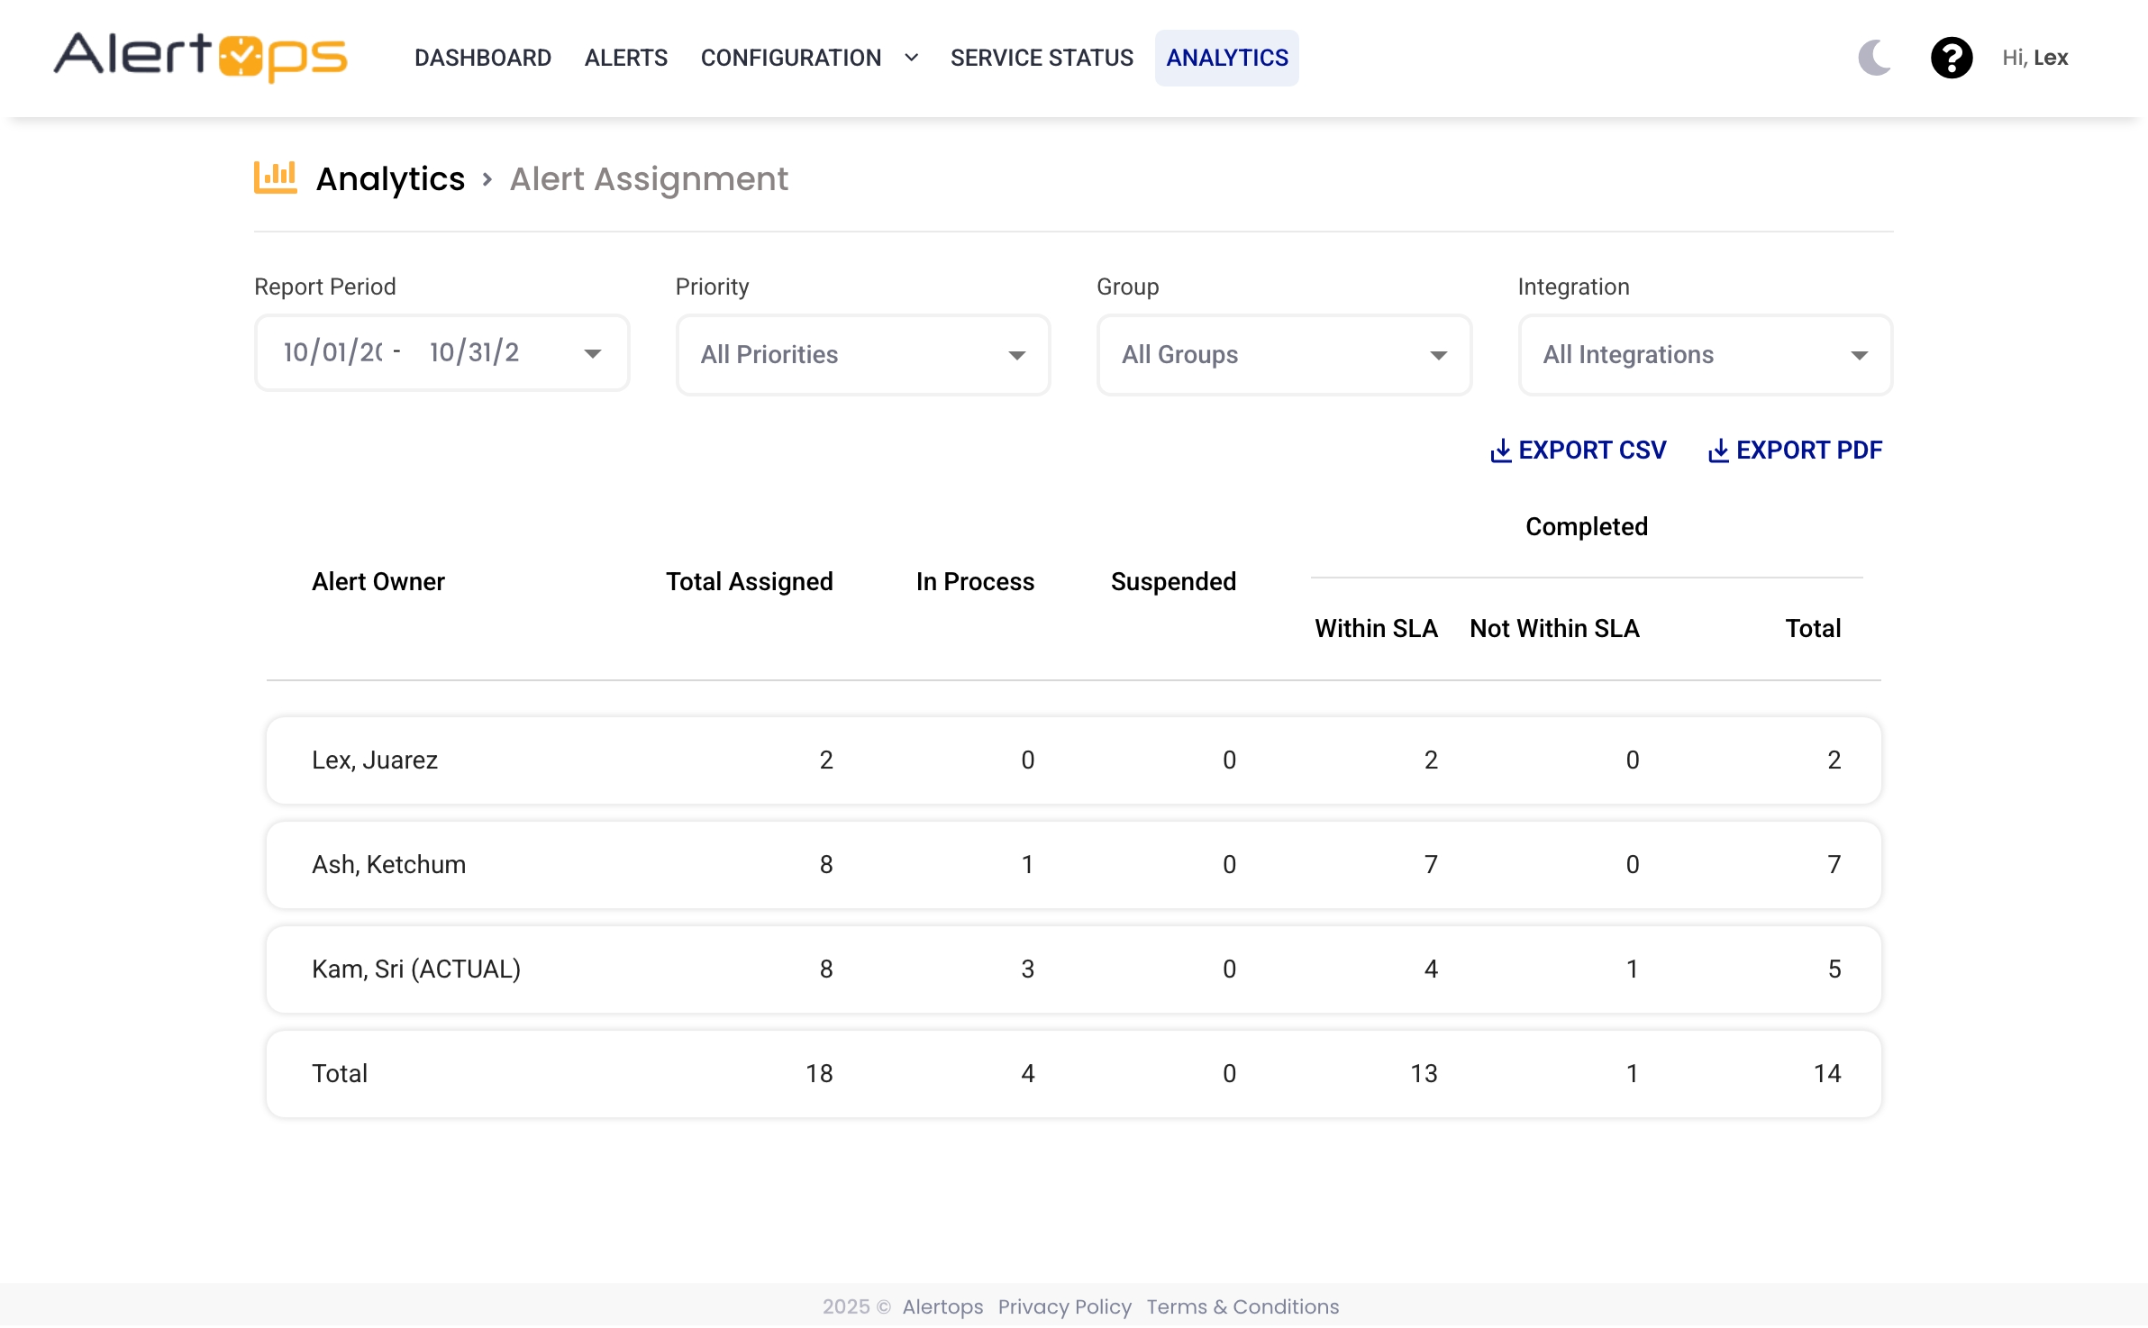
The Alert Assignment report in AlertOps tracks how alerts have been assigned to different owners over a specified date range, with a maximum range of 31 days. This limit ensures faster data retrieval. For longer-term metrics, users can utilize the export option for deeper analysis.
Key Features:
- Review Assignments by Owner: See how many alerts were assigned to each owner.
- Status Breakdown:
- In Process: Actively being handled.
- Suspended: Paused or waiting for further action.
- SLA Compliance: Tracks whether alerts were resolved within or outside the service-level agreement
- Filters Available:
- Group: View alerts based on assigned teams.
- Integration: Analyze alerts triggered by specific integrations.
- Priority: Focus on alerts of a certain urgency level.
This metric provides insight into alert distribution and response times, helping teams optimize incident management and accountability. For broader trend analysis beyond 31 days, use the export option.
Time to Acknowledge Report
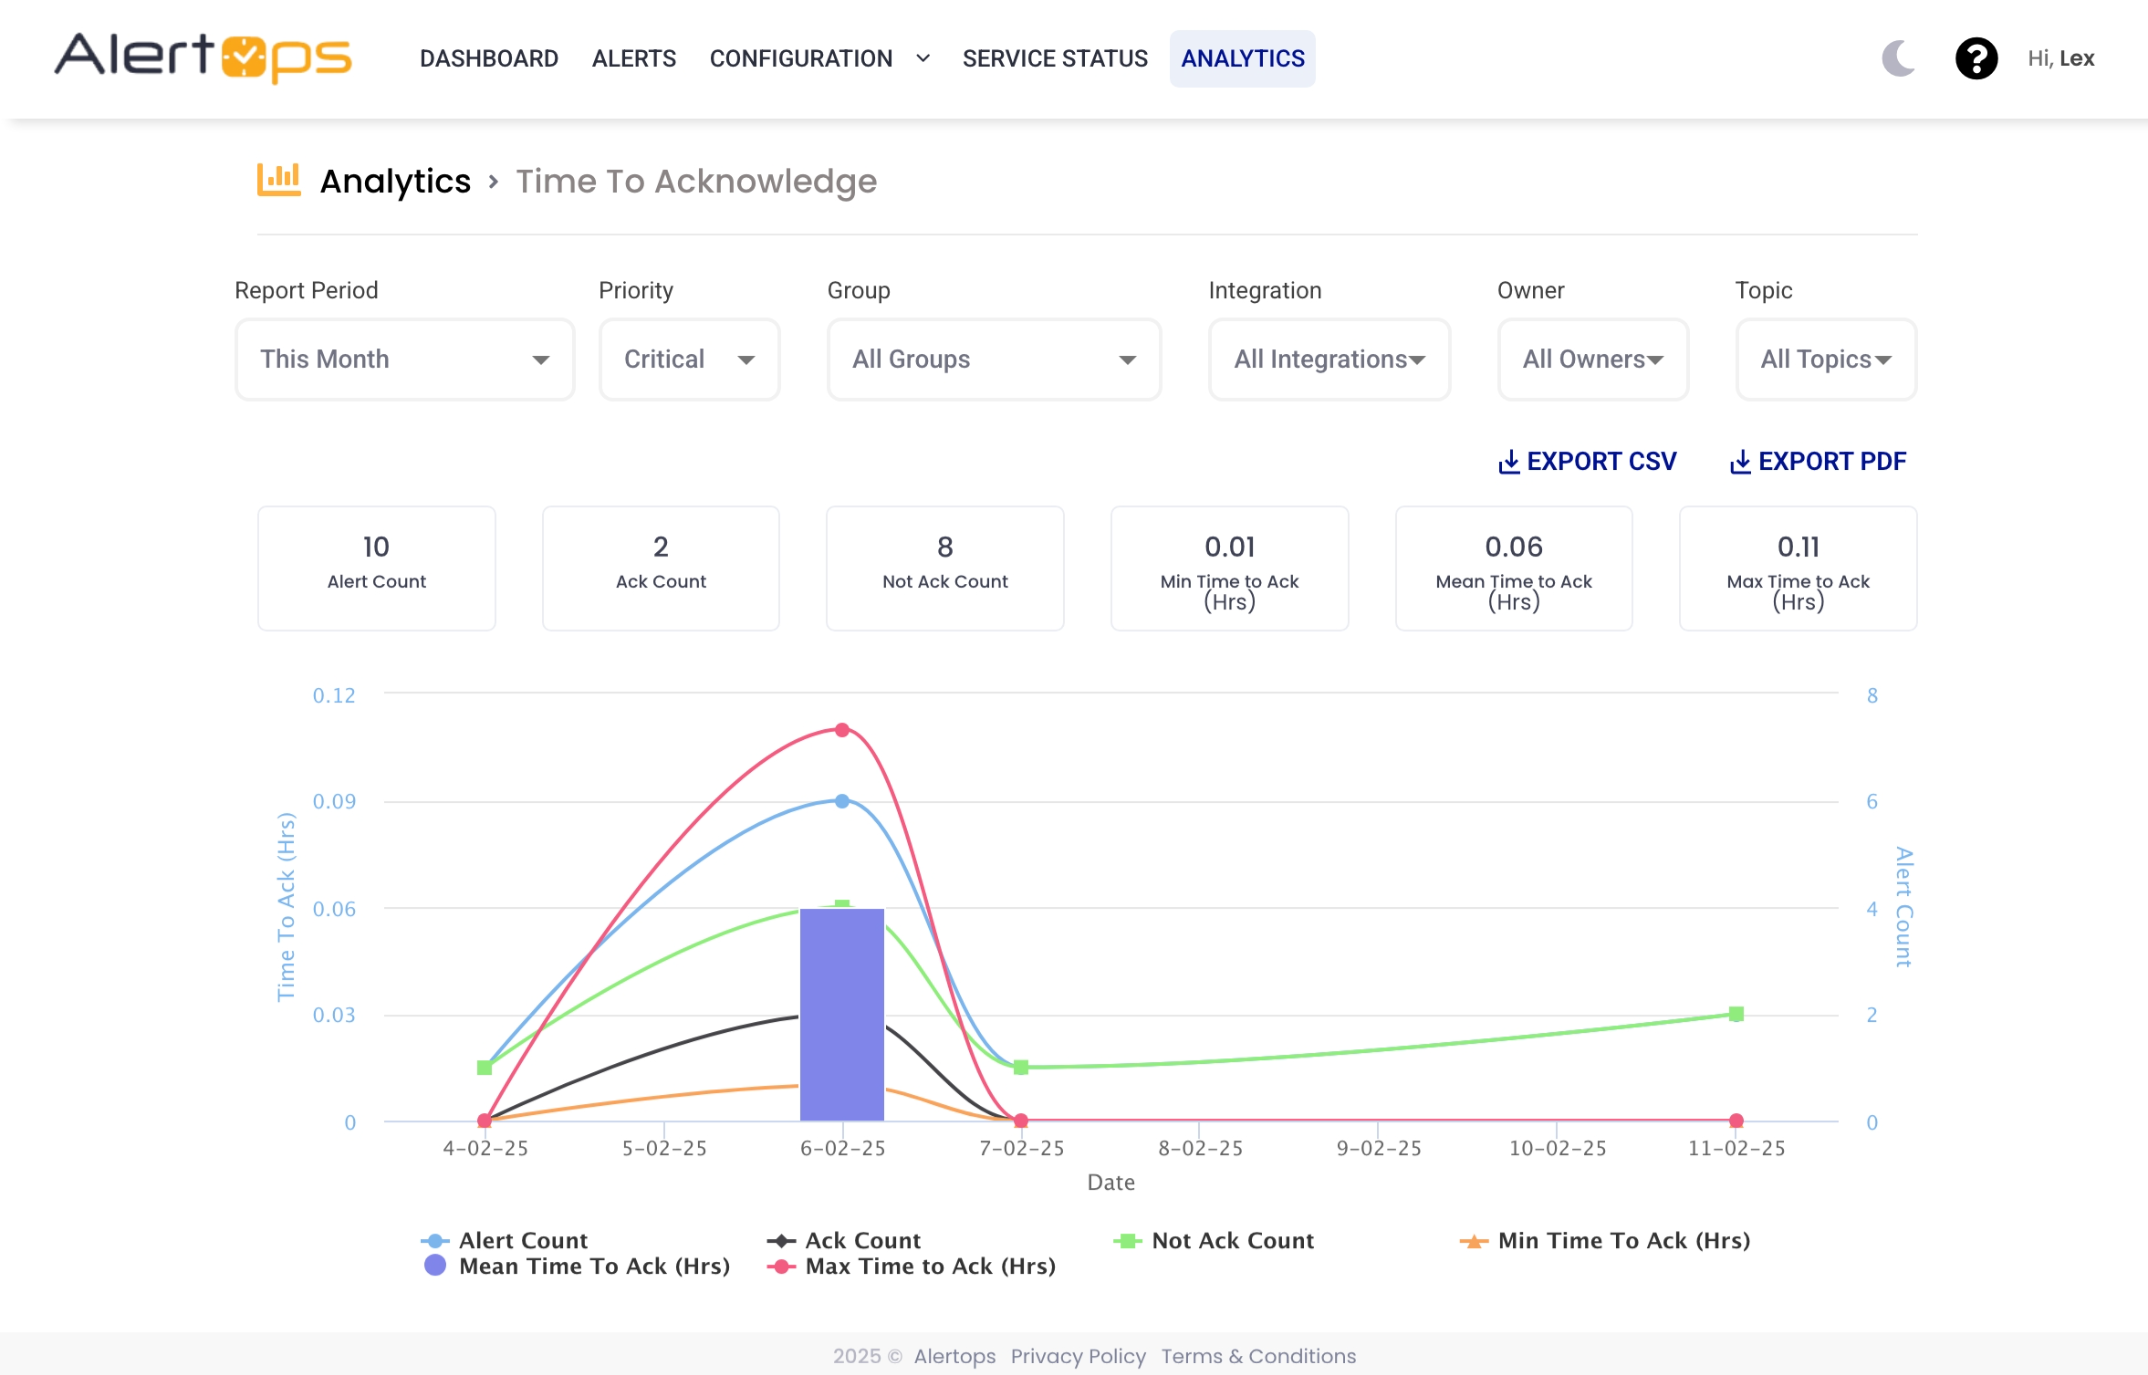
The Time to Acknowledge (TTA) metric in AlertOps helps track response efficiency by measuring how quickly alerts are acknowledged. This metric is essential for ensuring timely incident response and can be analyzed over the current or previous month to monitor trends and optimize response times.
Key Metrics Tracked:
- Total Alert Volume: The number of alerts generated within the selected period.
- Acknowledged Alerts (Ack Count): Alerts that have been acknowledged by responders.
- Unacknowledged Alerts (Not Ack Count): Alerts that have not yet received a response.
- Minimum Time to Acknowledge (Min Time to Ack): The shortest recorded acknowledgment time.
- Mean Time to Acknowledge (Mean Time to Ack): The average time taken to acknowledge alerts.
- Maximum Time to Acknowledge (Max Time to Ack): The longest recorded acknowledgment time.
Filtering Options:
Users can refine the data by:
- Group: Analyze acknowledgment times by team.
- Integration: View response times based on specific integrations.
- Priority: Compare response efficiency for different alert priority levels.
- Topic: Focus on alerts related to a specific issue type.
- Owner: Review acknowledgment performance for individual responders.
This metric provides valuable insight into response performance and helps teams improve their incident handling. If longer-term trends are needed, users can export the data for extended analysis.
Time to Resolve (TTR) Metric
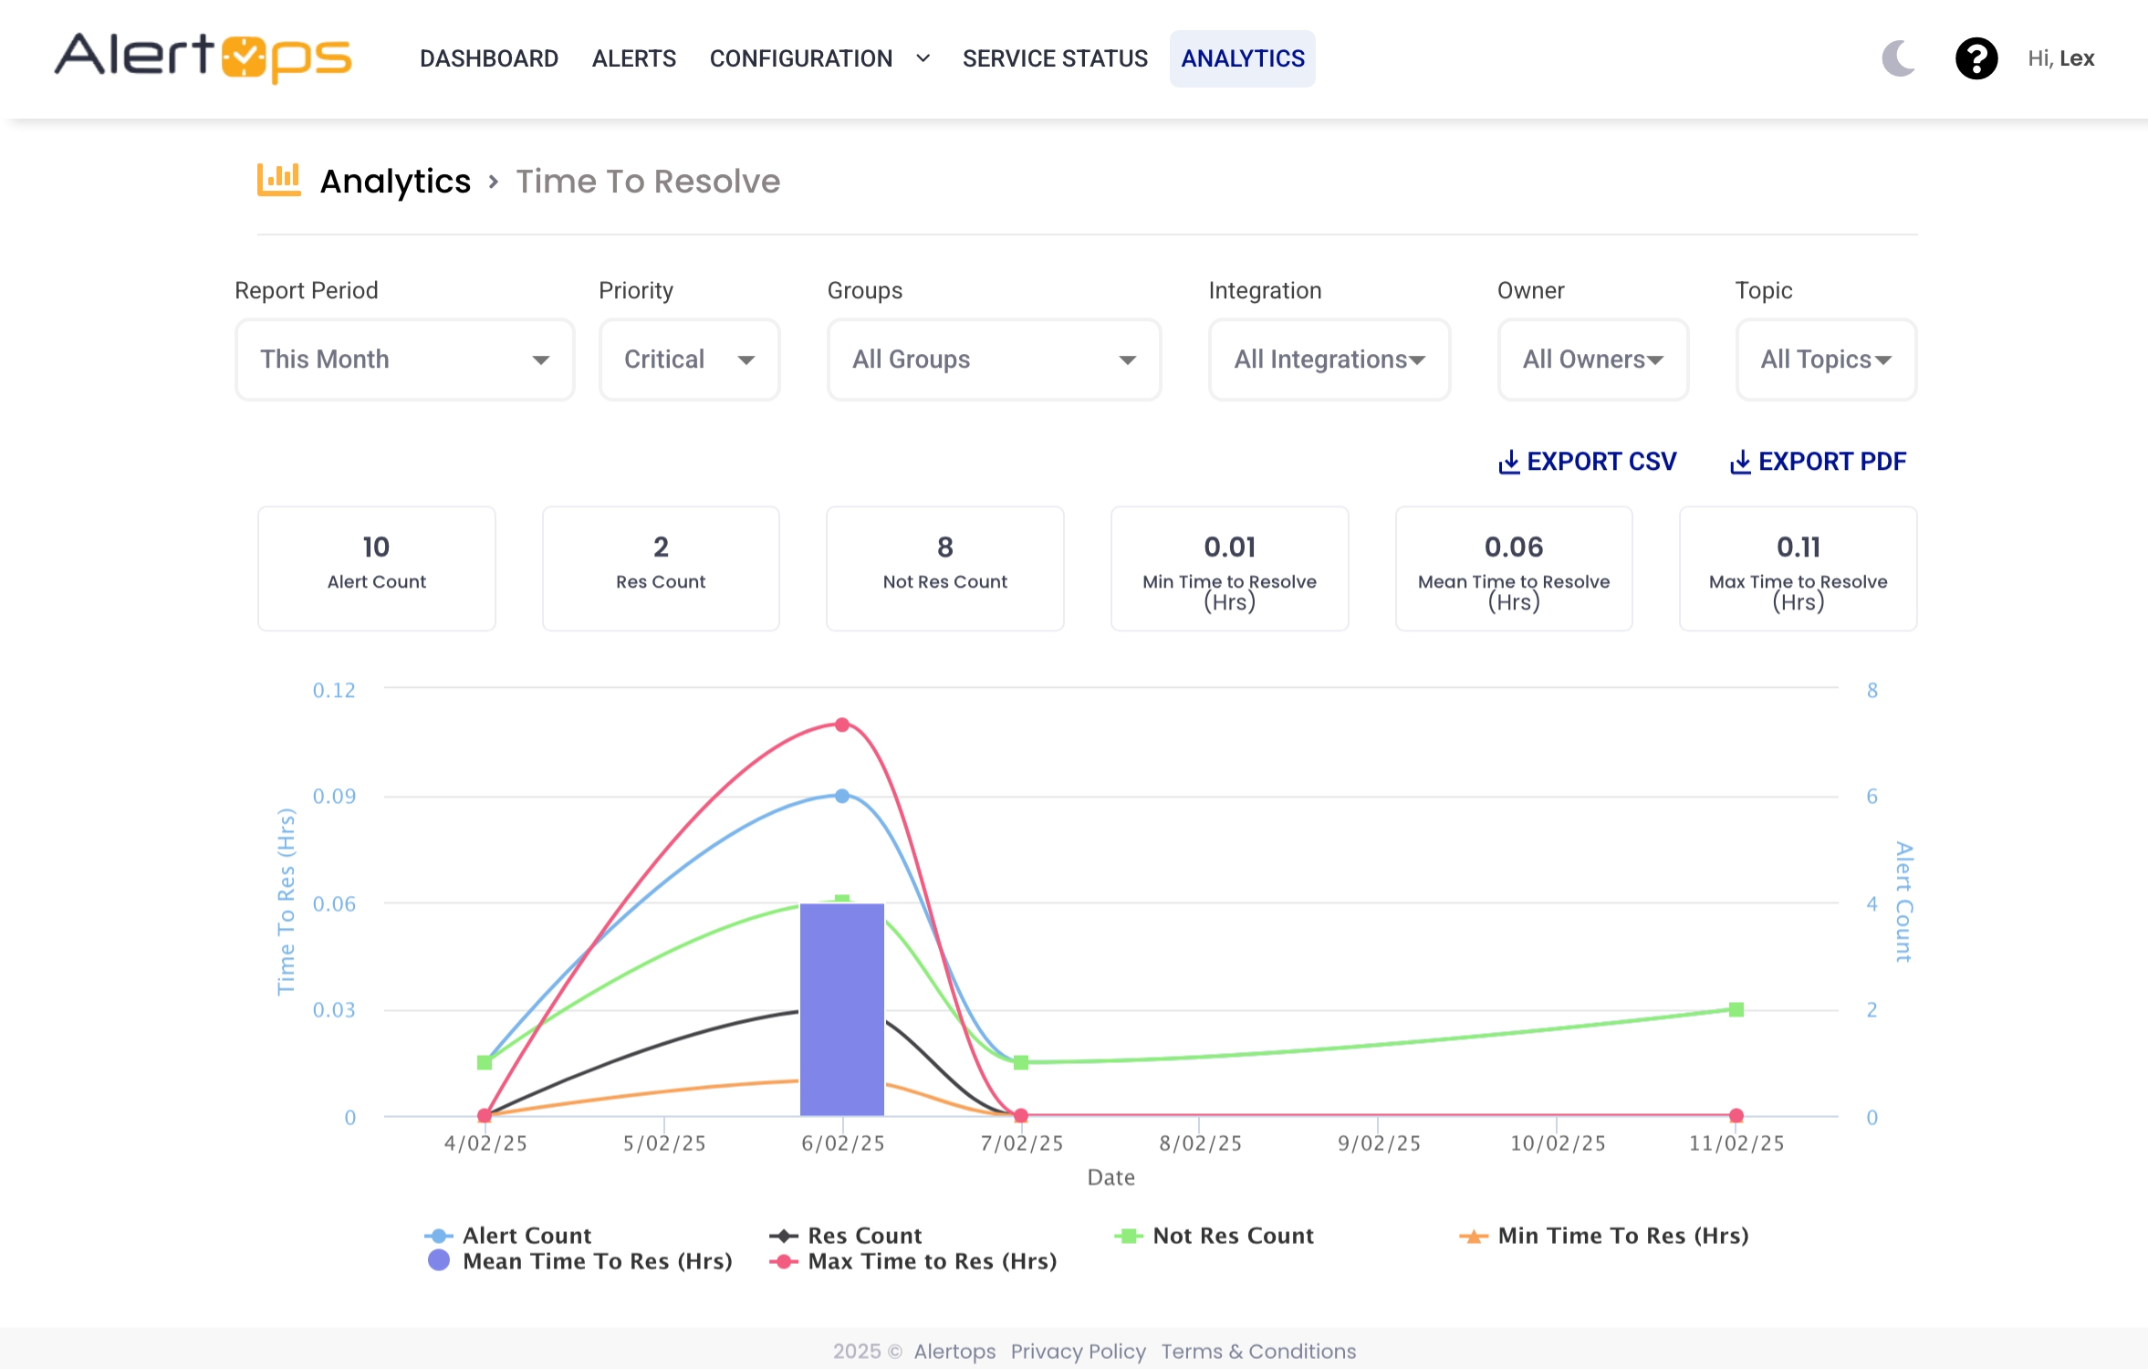
The Time to Resolve (TTR) metric in AlertOps helps track how quickly alerts are resolved. This metric is crucial for understanding incident resolution efficiency and can be reviewed over the current or previous month to analyze response performance and identify areas for improvement.
Key Metrics Tracked:
- Total Alert Volume: The number of alerts generated within the selected period.
- Resolved Alerts (Res Count): Alerts that have been successfully resolved.
- Unresolved Alerts (Not Res Count): Alerts that remain open and require further action.
- Minimum Time to Resolve (Min Time to Res): The shortest recorded resolution time.
- Mean Time to Resolve (Mean Time to Res): The average time taken to resolve alerts.
- Maximum Time to Resolve (Max Time to Res): The longest recorded resolution time.
Filtering Options:
Users can refine the data by:
- Group: Analyze resolution times by team.
- Integration: View resolution times based on specific integrations.
- Priority: Compare resolution efficiency for different alert priority levels.
- Topic: Focus on alerts related to a specific issue type.
- Owner: Review resolution performance for individual responders.
This metric provides valuable insight into incident management and helps teams optimize their workflows. For extended trend analysis beyond the available time frame, users can export the data.
On Call Report

The On Call report in AlertOps provides a real-time view of the on-call roster. Users can monitor who is on call now, for a specific day, or for a selected week. This report helps management ensure coverage and quick response to alerts.
Key Features:
- Observe On Call Status: View who is on call at the current time, for a specific day, or for a selected week.
- Filtering by Group: Focus on on-call schedules for specific teams.
- Time Period Selection:
- Now: See who is currently on call.
- Day: Check the schedule for a selected day.
- Week: View the on-call rotation for the current or upcoming week.
- Limited to Two Weeks: The report allows selection for up to two weeks at a time for efficiency and accuracy.
- Export Options: Users can download the on-call schedule as a CSV or PDF file.
This report ensures teams have clear visibility into on-call responsibilities, reducing response times and improving incident management.
Alert Summary Report
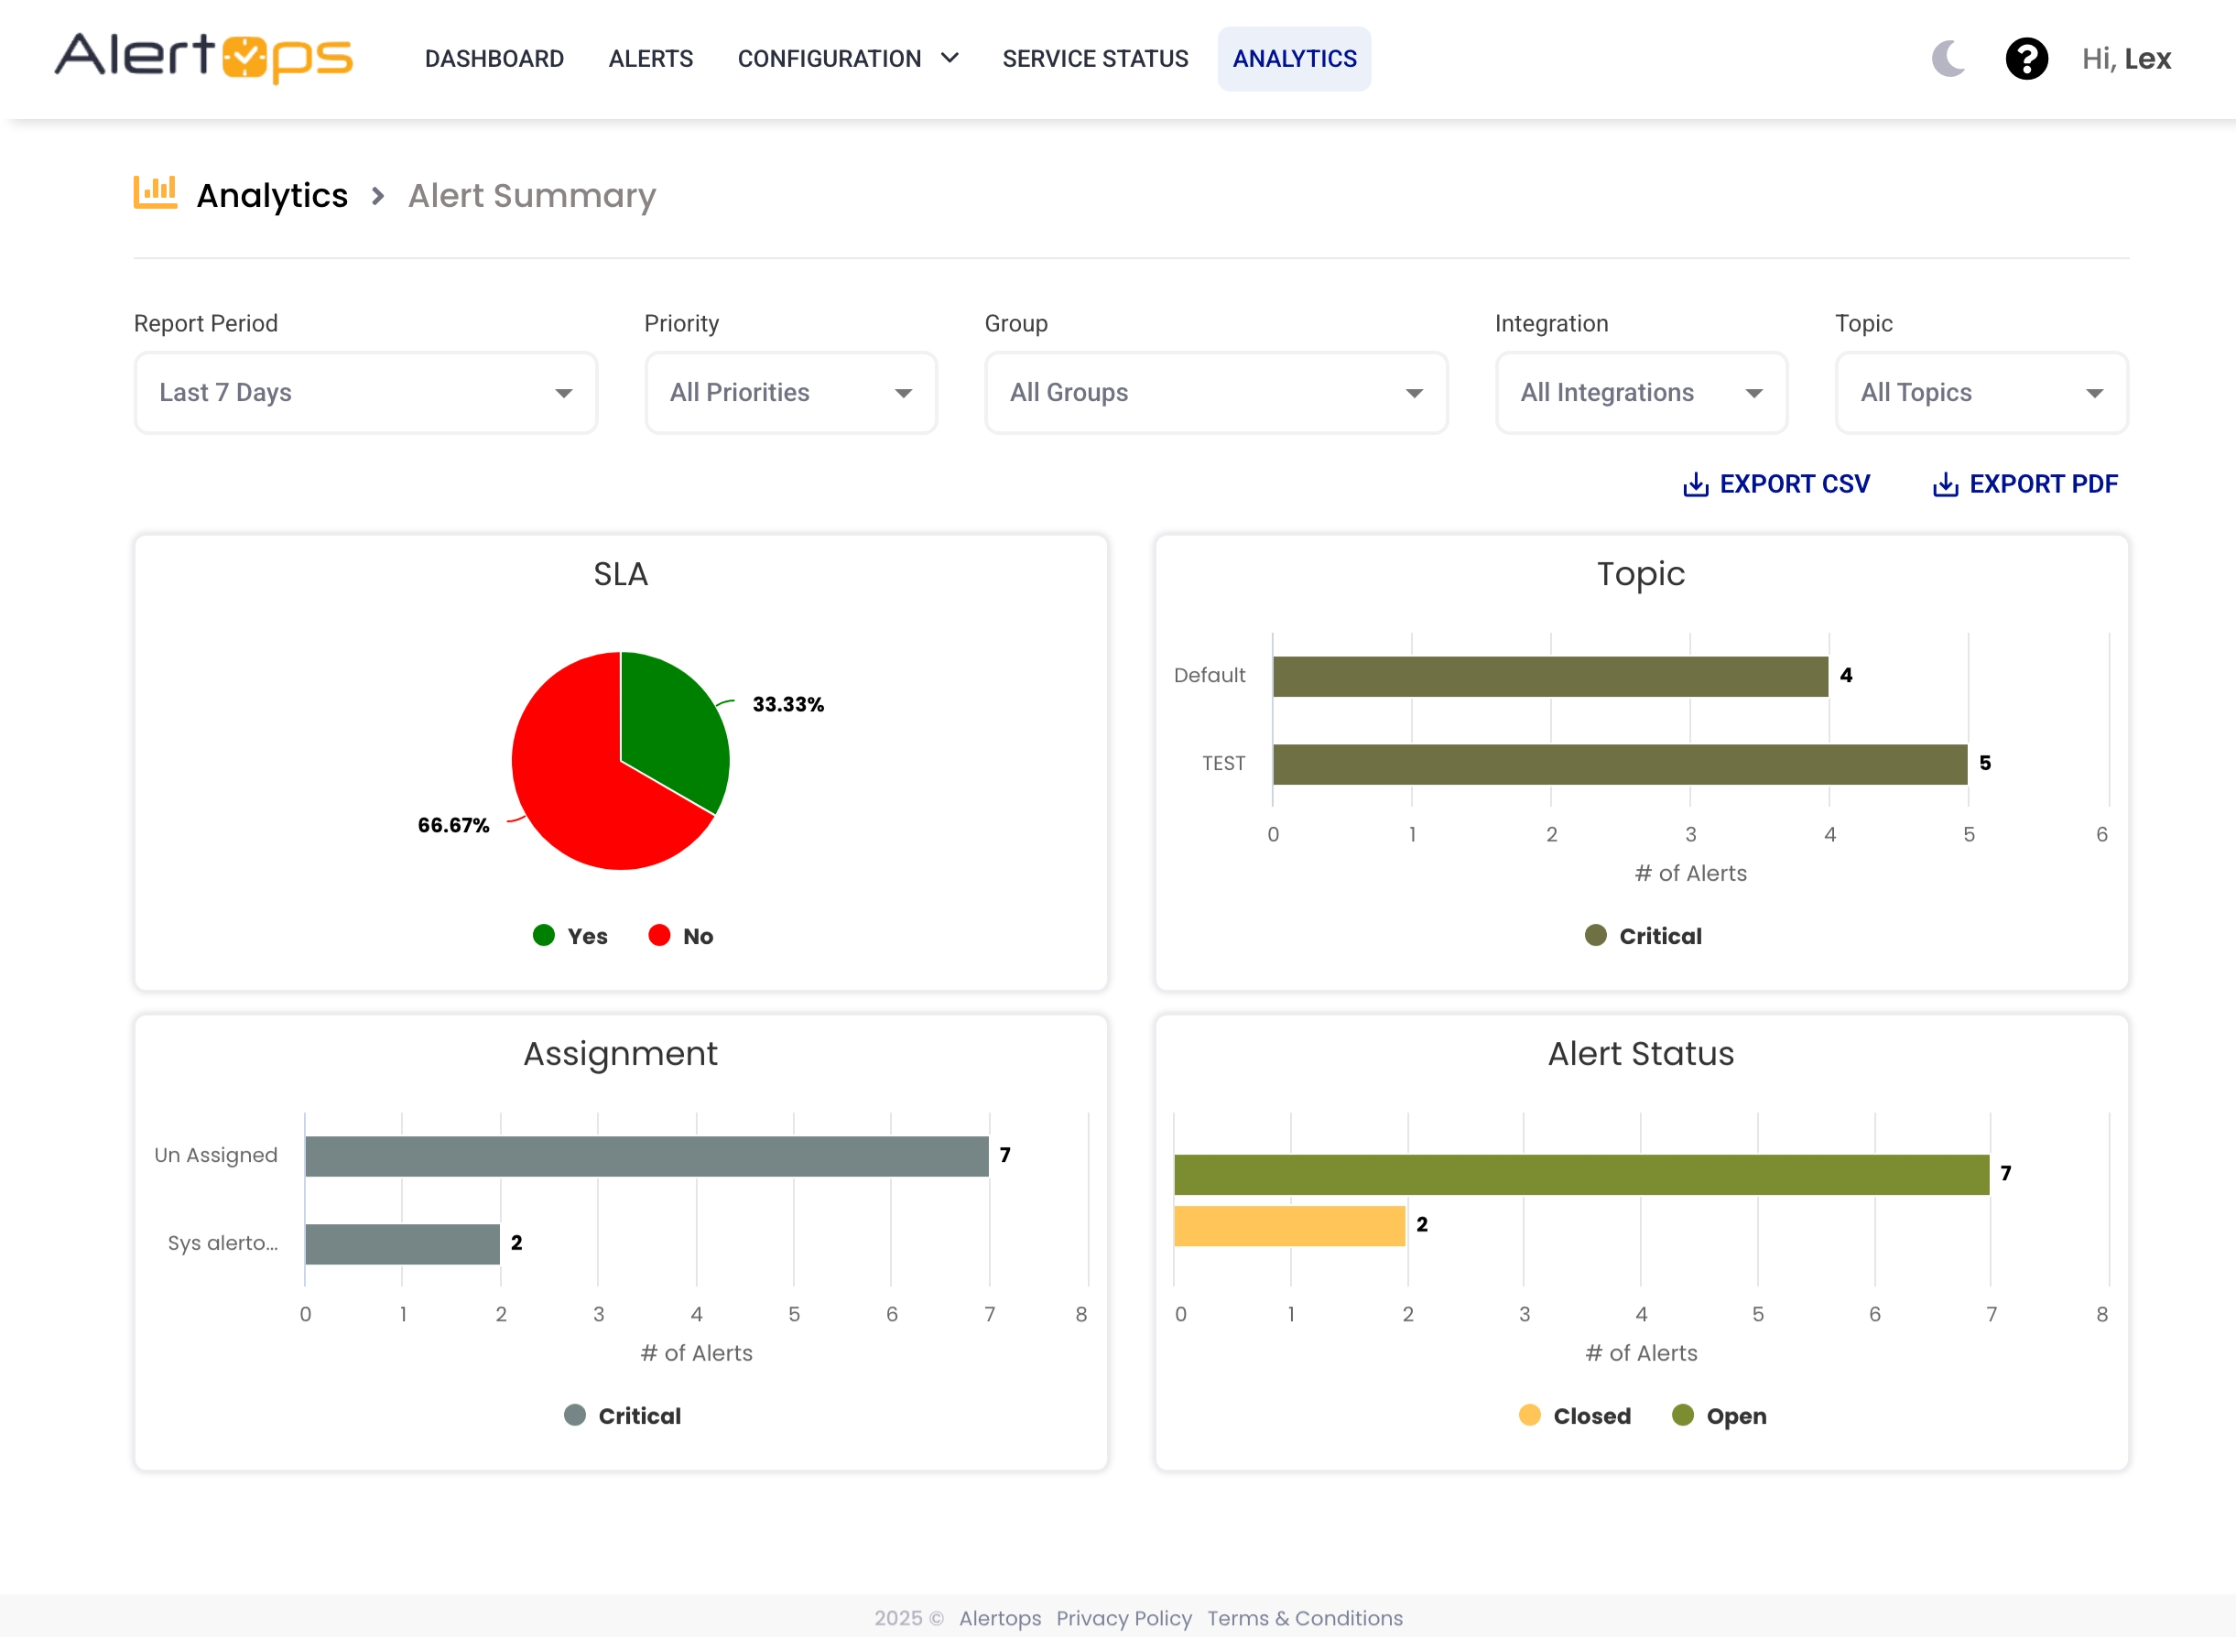
The Alert Summary report in AlertOps provides a graphical overview of key alert metrics over a specified date range. It helps teams monitor alert activity, track SLA adherence, analyze alert assignments, and assess alert statuses.
Key Metrics Tracked:
- SLA Adherence:Measures the percentage of alerts resolved within the service-level agreement (SLA).
- Topic Breakdown:Categorizes alerts by topic.
- Alert Assignment:Displays how alerts are distributed among responders.
- Alert Status:Tracks whether alerts are open or closed.
Filtering Options:
Users can refine the data by:
- Group: View alerts for specific teams.
- Integration: Analyze alerts triggered by specific integrations.
- Topic: Focus on alerts related to particular issues.
- Priority: Compare alerts based on their severity.
This report provides a comprehensive view of alert trends, enabling teams to optimize response strategies and improve operational efficiency.
Open Alerts Report
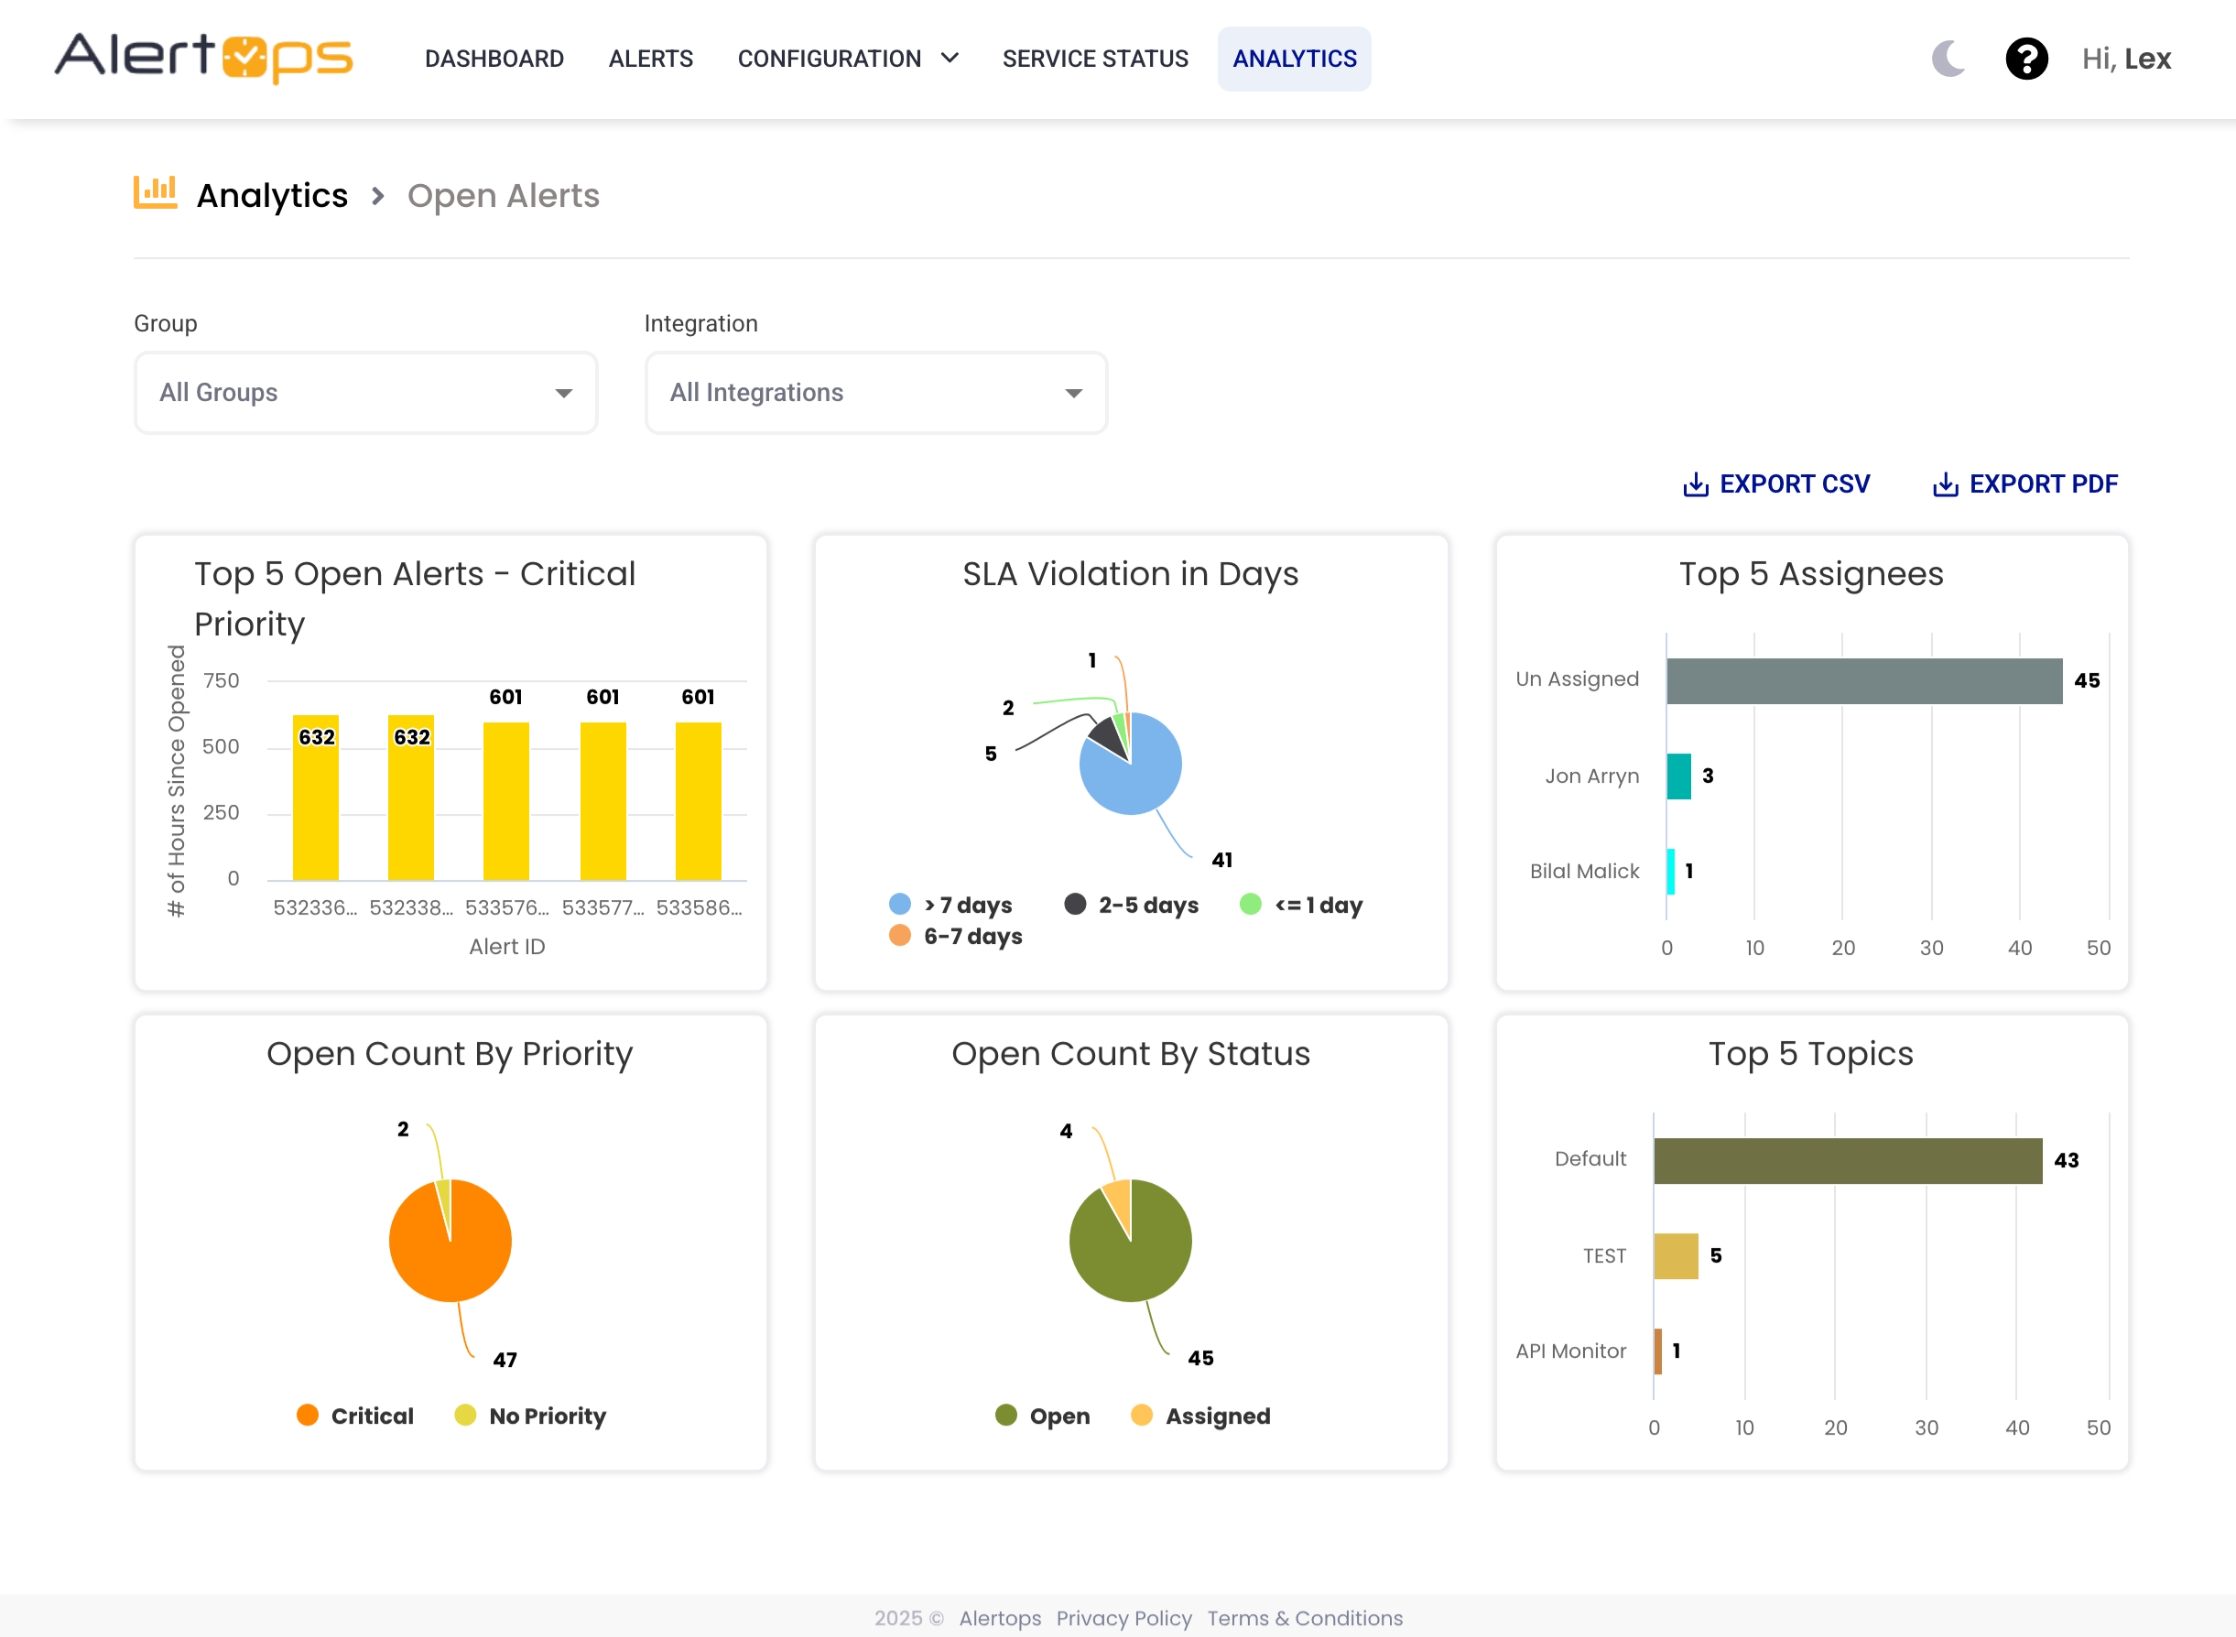
The Open Alerts report in AlertOps provides insights into all open alerts over the a maximum of 30 days. This report highlights key metrics, including alert priority, SLA adherence, and assignment status, helping teams manage ongoing incidents effectively.
Key Metrics Tracked:
- Top 5 Open Alerts - Critical Priority:Displays the most persistent critical alerts based on hours open.
- SLA Violation in Days:Tracks how long alerts have been open in violation of SLAs.
- Top 5 Assignees:Displays the most assigned alert owners.
- Open Count By Priority:Displays the distribution of open alerts by priority.
- Open Count By Status:Categorizes open alerts based on status.
- Top 5 Topics:Identifies the most common topics for open alerts.
Filtering Options:
Users can refine the data by:
- Group: View alerts for specific teams.
- Integration: Analyze alerts triggered by specific integrations.
This report provides a detailed overview of open alerts, enabling teams to identify long-standing issues and improve response efficiency.
Alert Trend Report
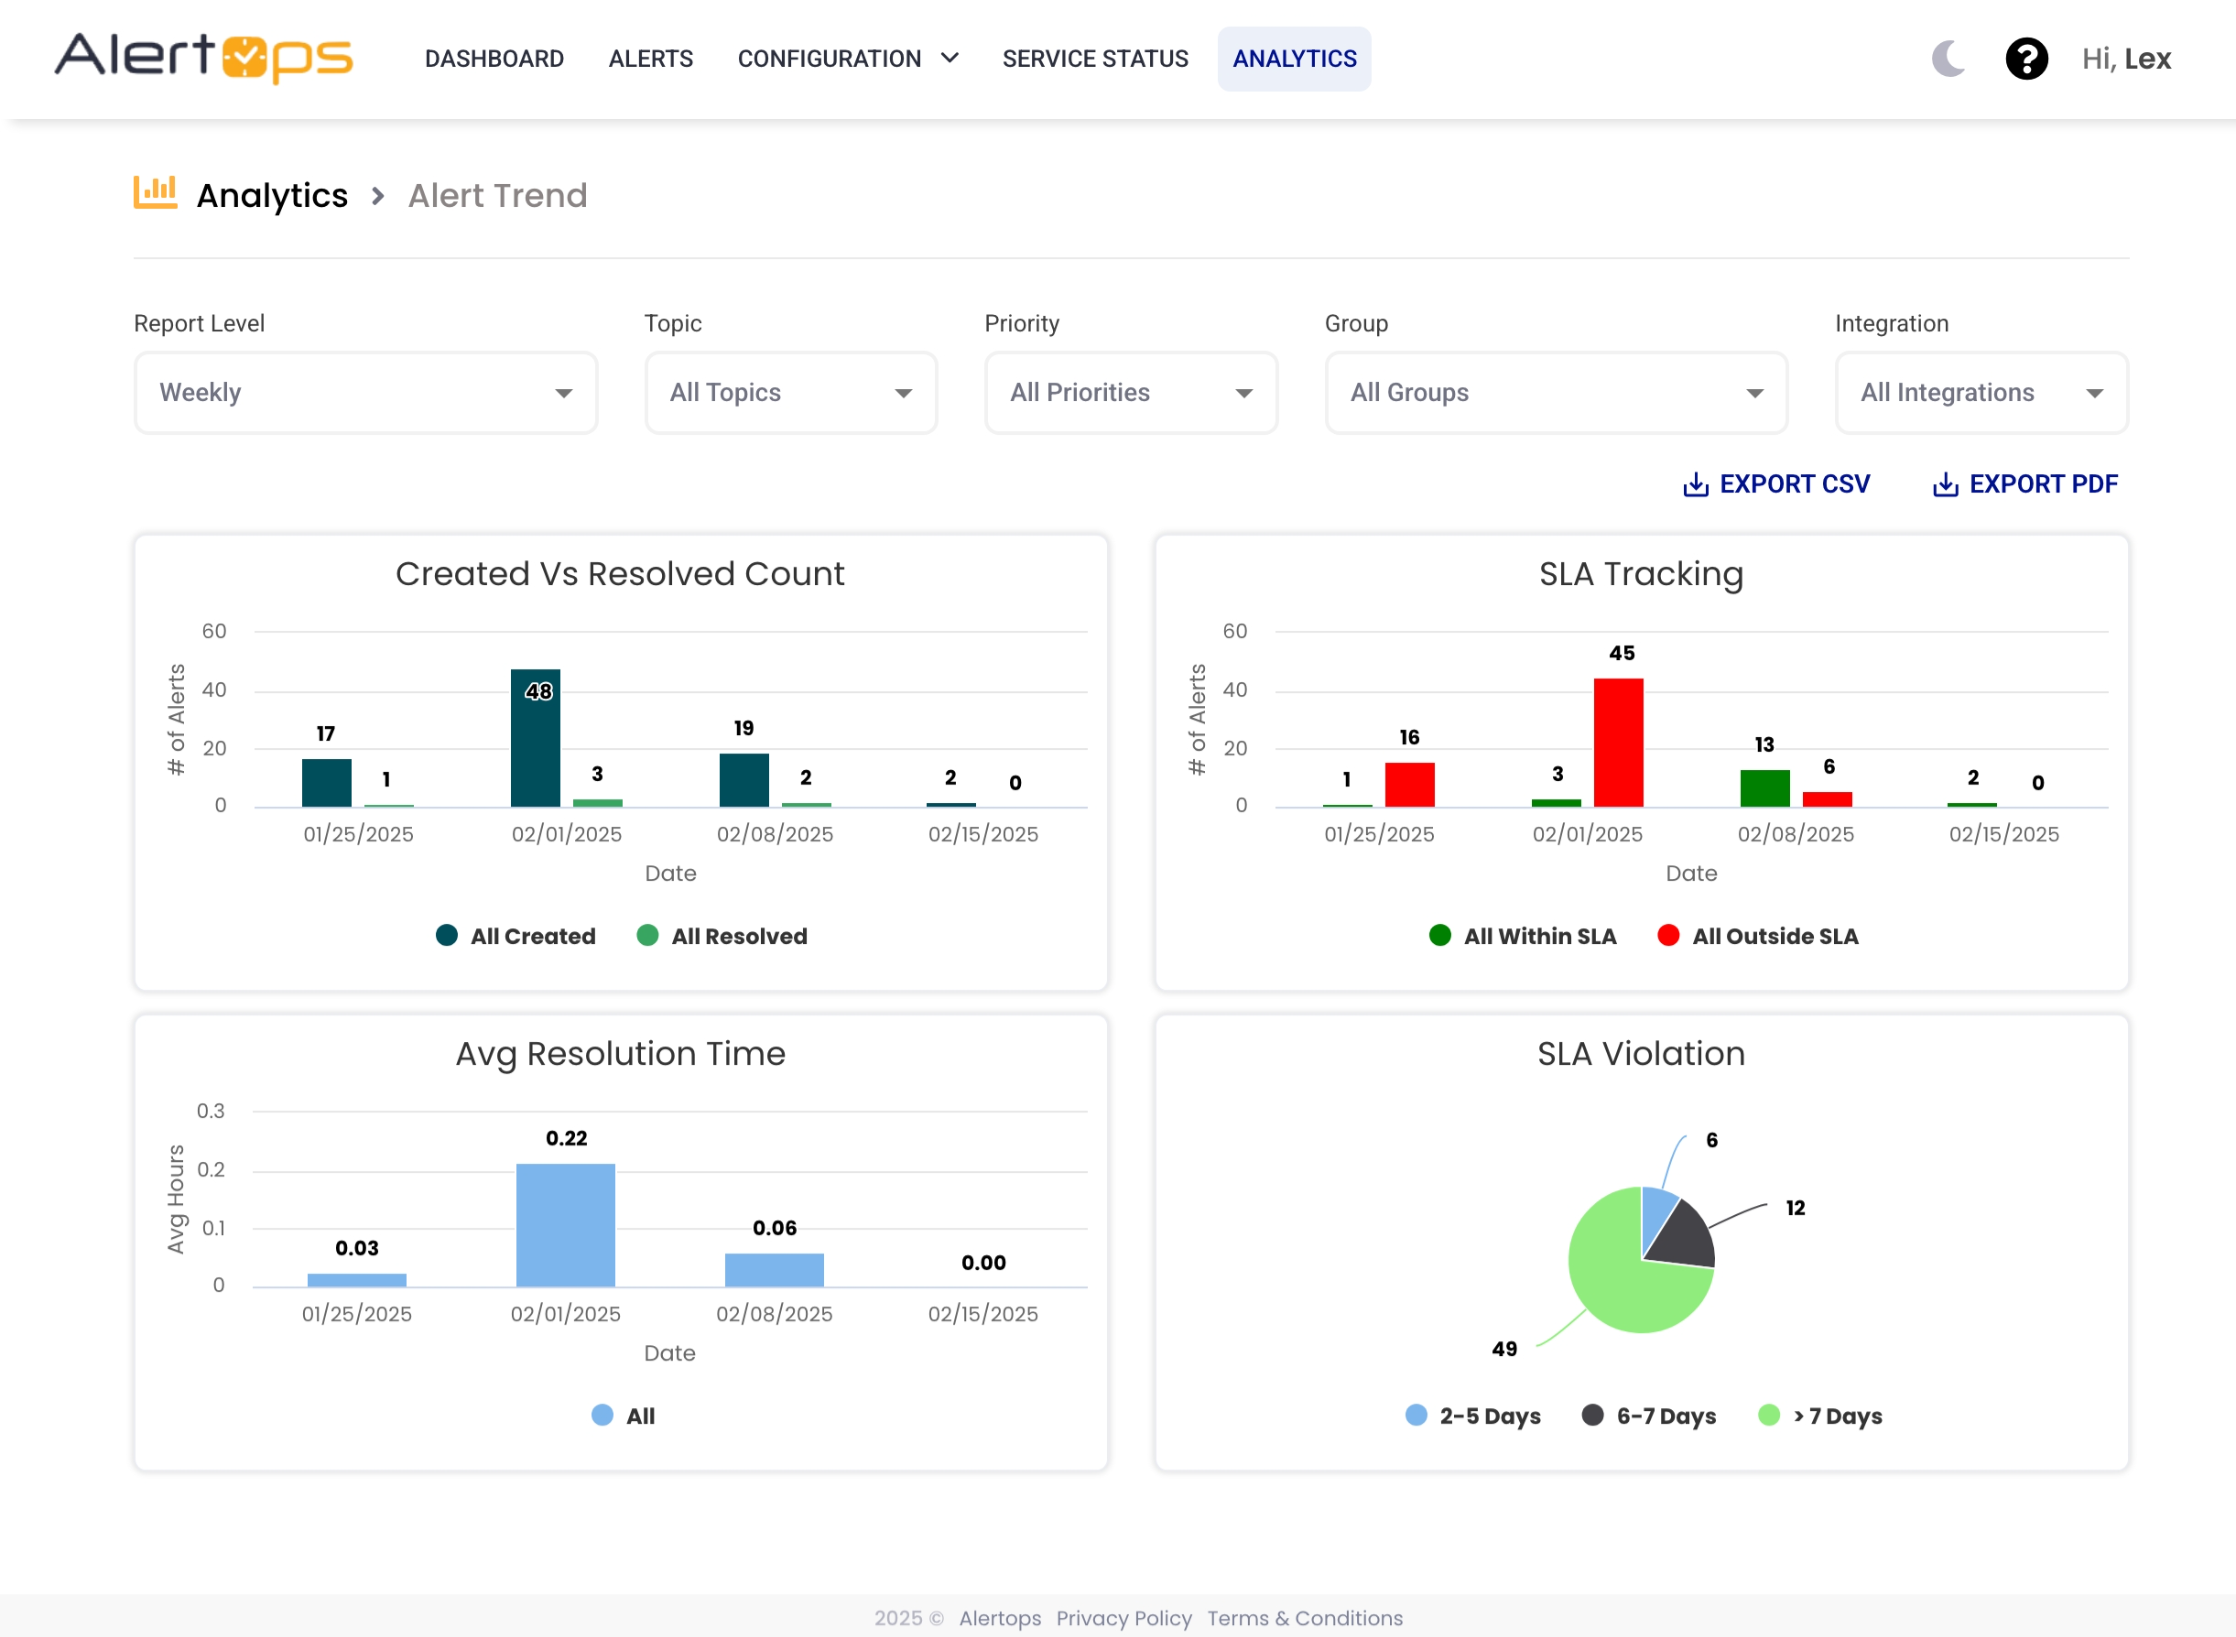
The Alert Trend report in AlertOps provides insights into alert volume, resolution performance, and SLA adherence. This report enables teams to track trends over different timeframes, including weekly, monthly, quarterly, and annual increments.
Key Metrics Tracked:
- Created vs Resolved Count:Compares the number of alerts created versus those resolved.
- SLA Tracking:Monitors alerts resolved within and outside the SLA.
- Average Resolution Time:Tracks the average time taken to resolve alerts.
- SLA Violation:Categorizes alerts based on the number of days they were open beyond the SLA.
Filtering Options:
Users can refine the data by:
- Group: View alerts for specific teams.
- Integration: Analyze alerts triggered by specific integrations.
- Topic: Focus on alerts related to particular issues.
- Priority: Compare alerts based on their severity.
This report helps teams track alert trends over time, identify potential bottlenecks, and improve incident resolution efficiency.
Was this article helpful?